师爷聊热点:
先接上昨天的分析,老鲍刚复读完鸽派废话,市场还没消化过来。结果财政部长贝森特立马跳出来喊着要降100到150个基点,搞得凌晨的大饼直接来一波反弹。
说白了这就是典型的情绪性补涨,根本不是趋势。能不能真扭转趋势,还得看10月底FOMC的最终指引。
贝森特的不满其实挺直接,老鲍那套扭扭捏捏的模样,完全没表态年底大幅降息,市场当然急了。现在大饼的波动,说白了就是押注未来降息到底快不快、狠不狠。
然而昨晚的美股还是一坨翔,但大饼倒是先探底反弹了一下。很多人喜欢拿美股和大饼对比,可实际上大饼的下跌往往提前一步,尤其周末的时候,简直就像是美股的天气预告。
不过市场情绪整体没出现系统性恐慌,这点算是好消息。周五的核心PCE数据才是关键,这数据要是低于或等于预期,能提振下市场。但要是高于预期,哎哟喂,怕是又得折腾一波。
另外别忘了,利好落地变利空的魔咒还在。一次小打小闹的降息根本解决不了啥,牛市归来要等利率真砍到位才行。在这之前,市场就是反复探底震荡。
回到市场,短期来看大饼算是探底成功了。昨晚终于搞出一波像样的放量反弹,甚至突破了四小时布林带中轨,直接顶到114K这个日线压力位。
以太和部分山寨的走势看上去更稳一点,不像大饼那样三针探底越扎越低,看着都心慌。以太是双针探底横盘支撑,反弹量能一般,明显有点不情愿跟着大饼创新低。
但说实话,现在市场整体没啥活可以整。插到114K就收针,今天又开始回调,妥妥的震荡行情。短期我也会盯着111.6K,这里估计还得再清算一波多头。
至于以太,现货ETF数据也是一坨翔。净流入为零,简直尴尬。虽然净流出和大饼差不多,但购买力明显疲软。大饼好歹还有点韧劲,抛售不算多,以太这边完全没有存在感。
之前吹上天的所谓战略储备现在没人提了,相关股票也全是垃圾走势。短期内以太除非能突然提升购买力,否则想走强难度极大。
一小时级别就是低位震荡,死气沉沉的样子,得等大饼稳住了它才敢动。阻力4360,支撑4000,关键支撑我先看3880。别看以太小级别上连续9次尝试突破30分钟的压力位,结果次次失败,还插了3针。
插针就意味着清算爆仓加机构抄底,但4200上方明显堆积了大量套牢盘,每次试图冲破都会遇到解套抛压。现在这种走势,大概率就是继续横着震,顺带阴跌,恶心散户。
说到底这行情就是一直在磨蹭,想考验谁耐性就整谁。要是4000真破了,别犹豫,立马保护你的仓位,不然就只能等着被割了........
师爷看趋势:
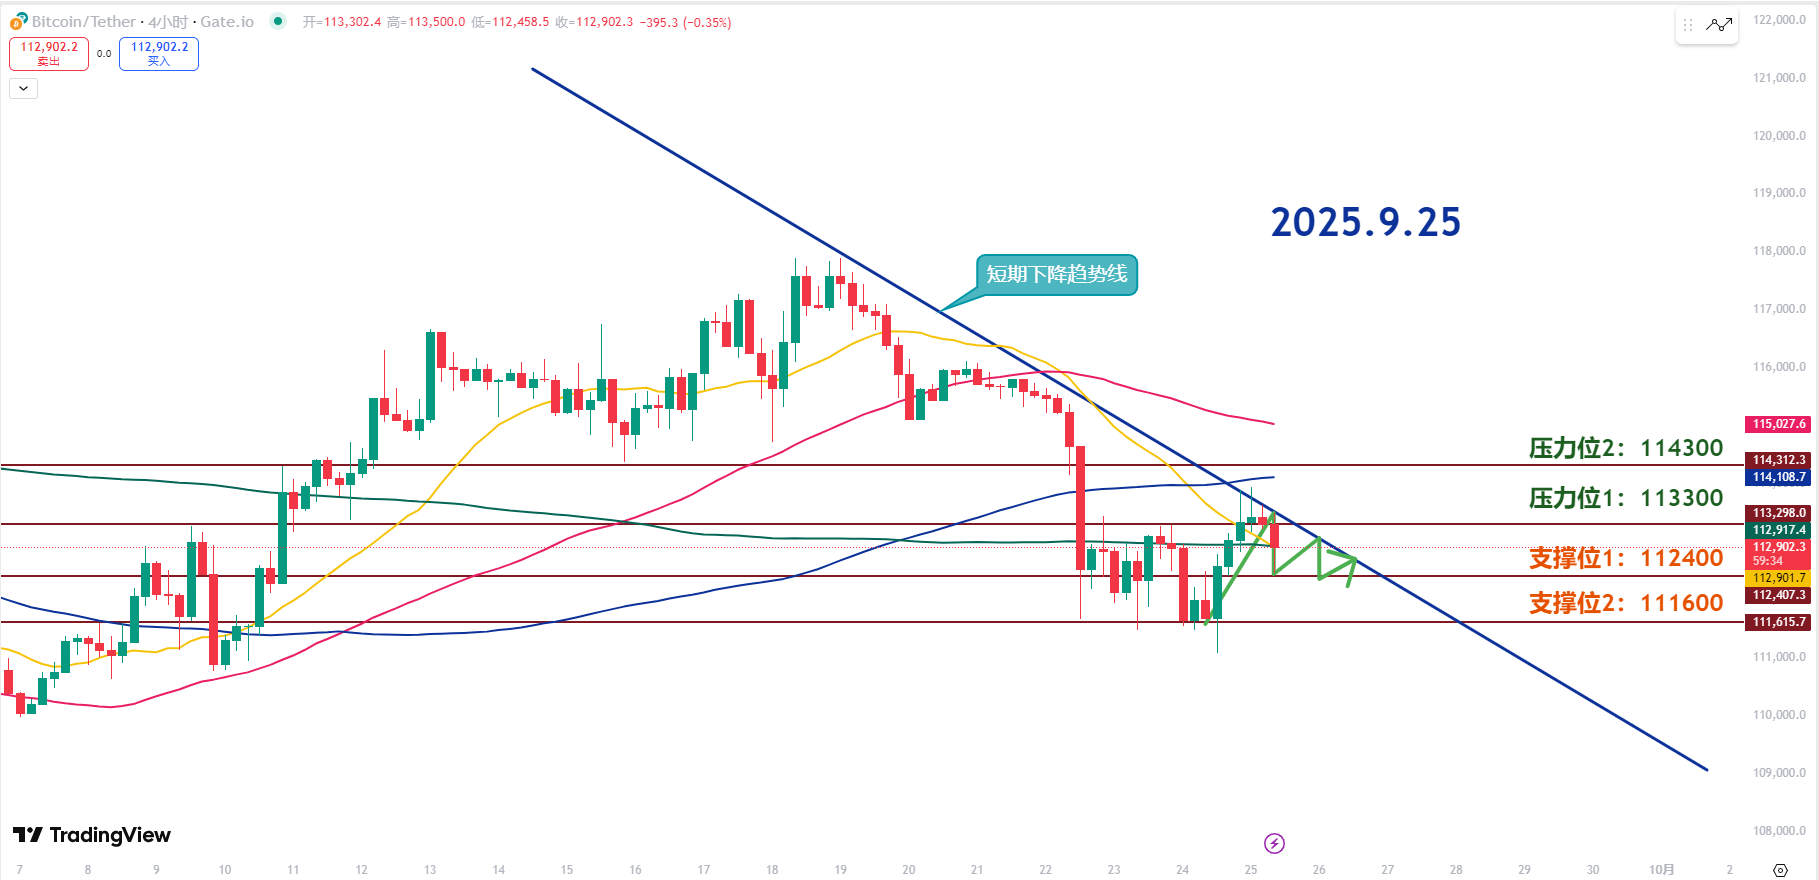
阻力位参考:
第二阻力位:114300
第一阻力位:113300
支撑位参考:
第一支撑位:112400
第二支撑位:111600
4小时级别来看,昨天大饼没能稳在113K上方,被上方长周期均线压着在区间震荡。短期下降趋势线还压着,布林带越收越窄。就是一副观望的德行,没方向。
昨天在112.4K的支撑上弹了一下,现在又回头去测113K。但布林带收口得厉害,所以趋势性行情暂时不会来,继续玩区间震荡。
4小时120MA、60MA死叉压头,均线空头排列,还是下跌趋势主导。如果后面横盘的情况下能慢慢突破下降趋势线,再配合布林带开口,那才有可能来一波像样的反弹。
现在正在尝试稳住4小时200MA,如果K线下影线撑住,说明下方有人接盘,短线还能继续看反弹。112~112.4K是关键支撑区,这个位置守不住,就别谈什么趋势反转了。
第一阻力113.3K这里是前高,必须重新突破才能算是打破短期下跌趋势才有反弹机会。第二阻力114.3K,就算突破了第一阻力,上面还有120MA、60MA和布林带上轨压着,没新利好根本冲不动。
第一支撑112.4K是短线最关键的位置,守得住还能盘。跌破了就容易触发恐慌盘,直接来一波加速下跌。
第二支撑111.6K,上次下跌就是在这位置止住的。如果112K守不住,就得小心继续往下跌,布林带下轨撑不住的话,大概率就会走阶梯式下跌。
今天的行情就是被限制在小区间内,涨跌空间都不大。别想着拿长线单,走到该止盈的点位就要及时撤退。
9.25师爷波段预埋:
做多入场位参考:暂不参考
做空入场位参考:113300-114300区间分批空 目标:112400-111600
如果你真心想从一个博主那里学到东西,那就得持续关注,而不是看几次行情就妄下定论。这个市场充斥着表演型选手,今天多单截图,明天空单总结,看起来“次次抓顶抄底”,实际上全是马后炮。真正值得关注的博主,交易逻辑一定是前后一致、自洽且经得起推敲的,而不是行情动了才来跳大神。别被浮夸数据和断章截图迷了眼,长期观察、深度理解,才能分辨谁是思考者,谁是造梦人!
本文内容由师爷陈(公众号:币神师爷陈)独家策划发布,师爷陈全网同名。如需了解更多实时投资策略、解套、现货,短、中、长线合约交易手法、操作技巧以及K线等知识可以加到师爷陈学习交流,现已开通粉丝免费体验群,社区直播等优质体验项目!

温馨提示:本文只有专栏公众号(上图)是师爷陈所写,文章末尾及评论区其他广.告均与笔者本人无关!!请大家谨慎辨别真假,感谢阅读。
免责声明:本文章仅代表作者个人观点,不代表本平台的立场和观点。本文章仅供信息分享,不构成对任何人的任何投资建议。用户与作者之间的任何争议,与本平台无关。如网页中刊载的文章或图片涉及侵权,请提供相关的权利证明和身份证明发送邮件到support@aicoin.com,本平台相关工作人员将会进行核查。


