Cryptocurrency News
September 24 Highlights:
1. European Central Bank: Digital Euro may be launched by mid-2029
2. Morgan Stanley to offer cryptocurrency trading services through E*Trade
3. FTX Trust sues Bitcoin mining company Genesis Digital, seeking $1.15 billion in investment recovery
4. U.S. CFTC launches tokenized collateral program, allowing derivatives trading with stablecoins
5. High probability of a 25 basis point rate cut by the Federal Reserve in October at 93%
Trading Insights
Four Major Stages of Institutional Involvement in Digital Currency: A Practical Breakdown from Accumulation to Distribution
Accumulation Stage: The "quiet accumulation" period of the main players
The core action of institutional funds in this stage is to collect chips at low prices. At this time, institutions are the main buyers, while retail investors are mostly sellers. From the market characteristics, it can be judged through the relationship between volume and price: when the price of digital currency is in a low range, there will be a stepwise increase in volume (gradually increasing trading volume), accumulation (continuous large transactions), and simultaneous rise in volume and price (price rises in sync with trading volume). These characteristics correspond directly to the chip distribution chart, reflecting that institutions are steadily accumulating.Rally Stage: The profit-taking period of the main players pushing up coin prices
After completing the accumulation, the price of digital currency will move away from its cost zone, and institutions will begin to realize paper profits. In this stage, institutions will use a small portion of funds to wash out (consolidate and clean up retail investors' floating chips), while most chips remain unchanged; corresponding to the chip distribution chart, a large number of chips still occupy the bottom area, which is the core holding of institutions, aiming to wait for subsequent high-level cashing out and further pushing up the coin price.Peak Stage: The signal period for institutions "preparing to exit"
When the price of digital currency is at a high level, if a large number of chips suddenly disappear from the bottom area, it is a clear sign of institutions preparing to distribute. The key characteristics of this stage are: low-level chips continuously move to high levels and form a dense accumulation at high levels, while the market turnover rate significantly increases (a large number of chips are exchanged at high levels), indicating that institutions are accelerating the transfer of chips, and the coin price is about to peak.Distribution Stage: The final period of institutions "cashing out"
After institutions complete profit-taking at high levels, market chips will be fully concentrated in the high range, with no institutional holding chips at the bottom. At this time, the distribution action of institutions has been completed, and the digital currency will lack upward momentum. Investors should not continue to hold and should immediately take stop-loss or take-profit actions to avoid being trapped.
LIFE IS LIKE
A JOURNEY ▲
Below are the real trading signals from the Big White Community this week. Congratulations to the friends who followed along. If your operations are not going well, you can come and test the waters.
Data is real, and each order has a screenshot from the time it was issued.
**Search for the public account: *Big White Talks About Currency*
BTC
Analysis
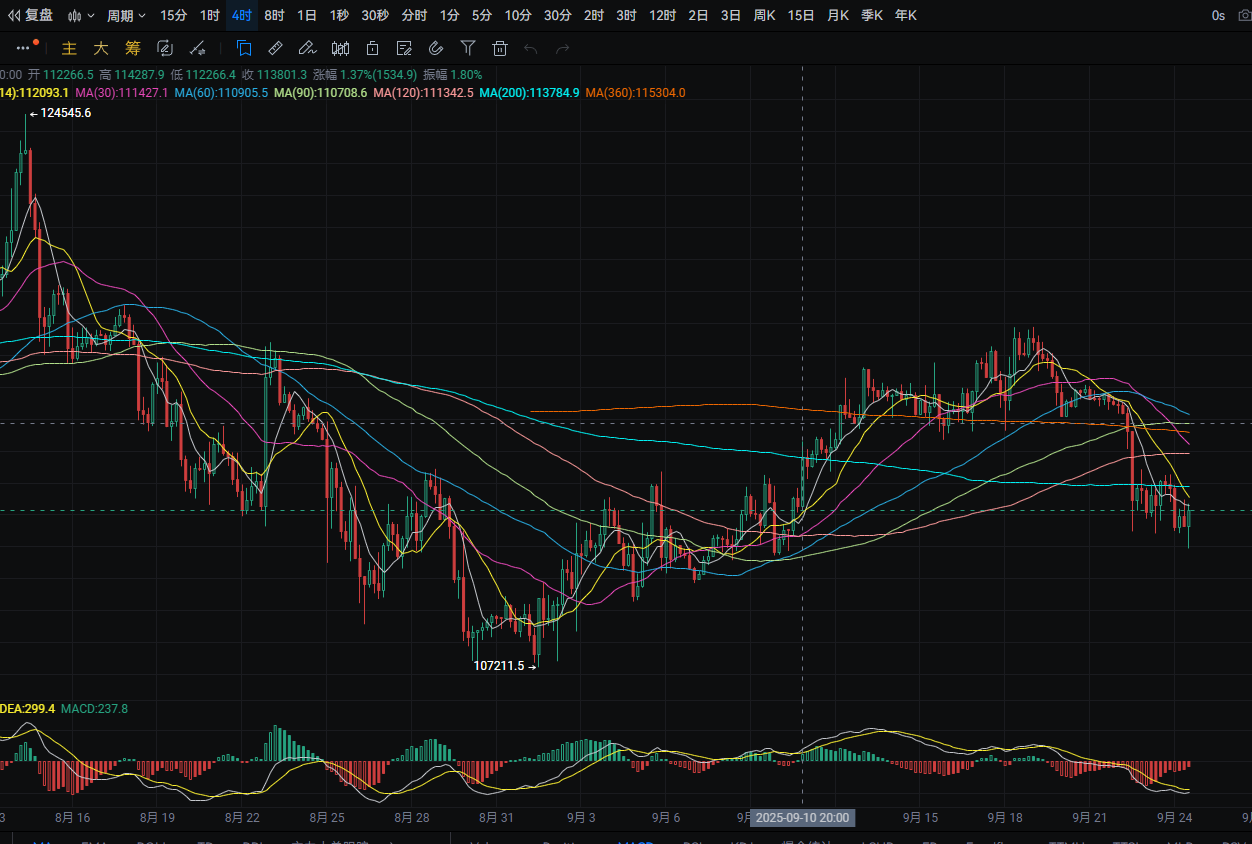
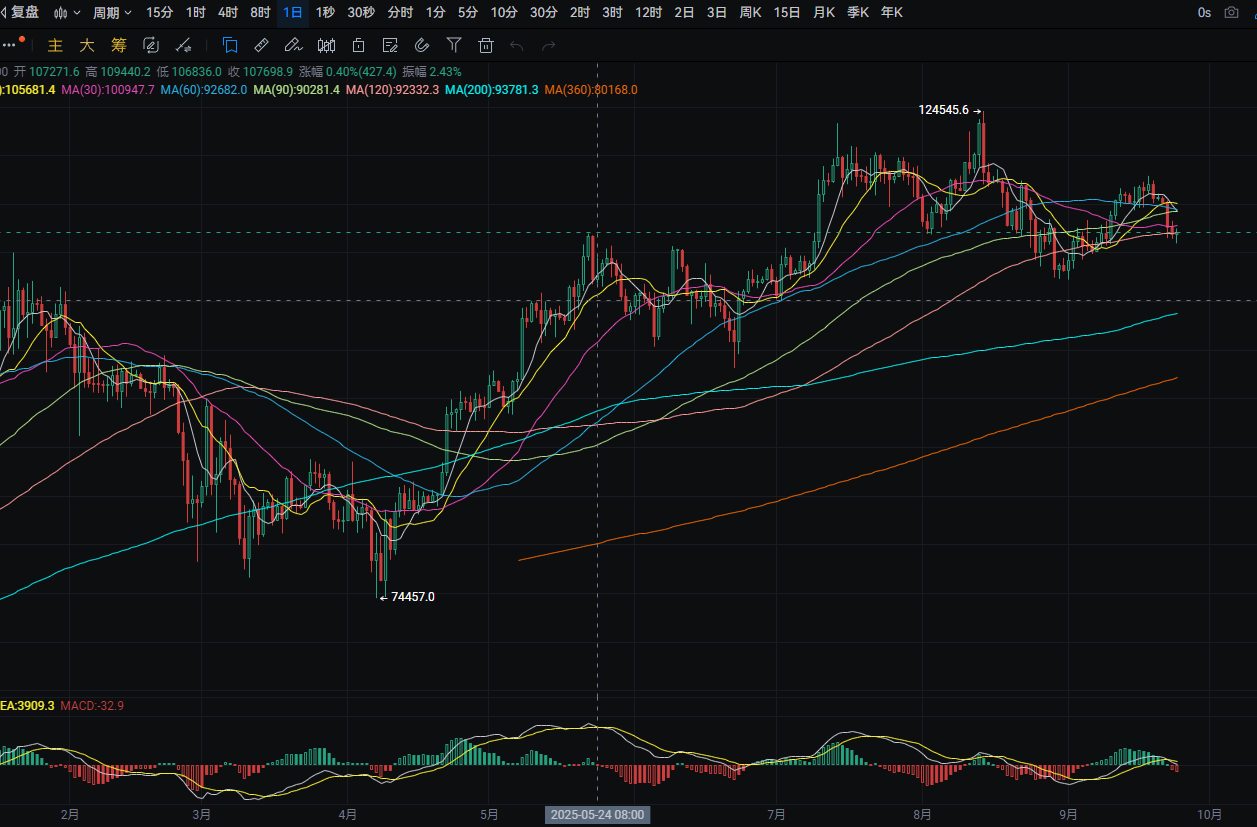
Bitcoin's daily line fell from a high of around 113250 to a low of around 111400 yesterday, closing around 111950. The support level is around 109100; if it breaks, it could drop to around 108100. A pullback can be bought near this level. The resistance level is around 113800; if it breaks, it could rise to around 115850. A rebound near this level can be sold short. MACD shows increasing bearish momentum. The four-hour support level is around 110750; if it breaks, it could drop to around 109450. A pullback can be bought near this level. The resistance level is near MA200; if it breaks, it could rise to MA120. A rebound near this level can be sold short. MACD shows decreasing bearish momentum.
ETH
Analysis
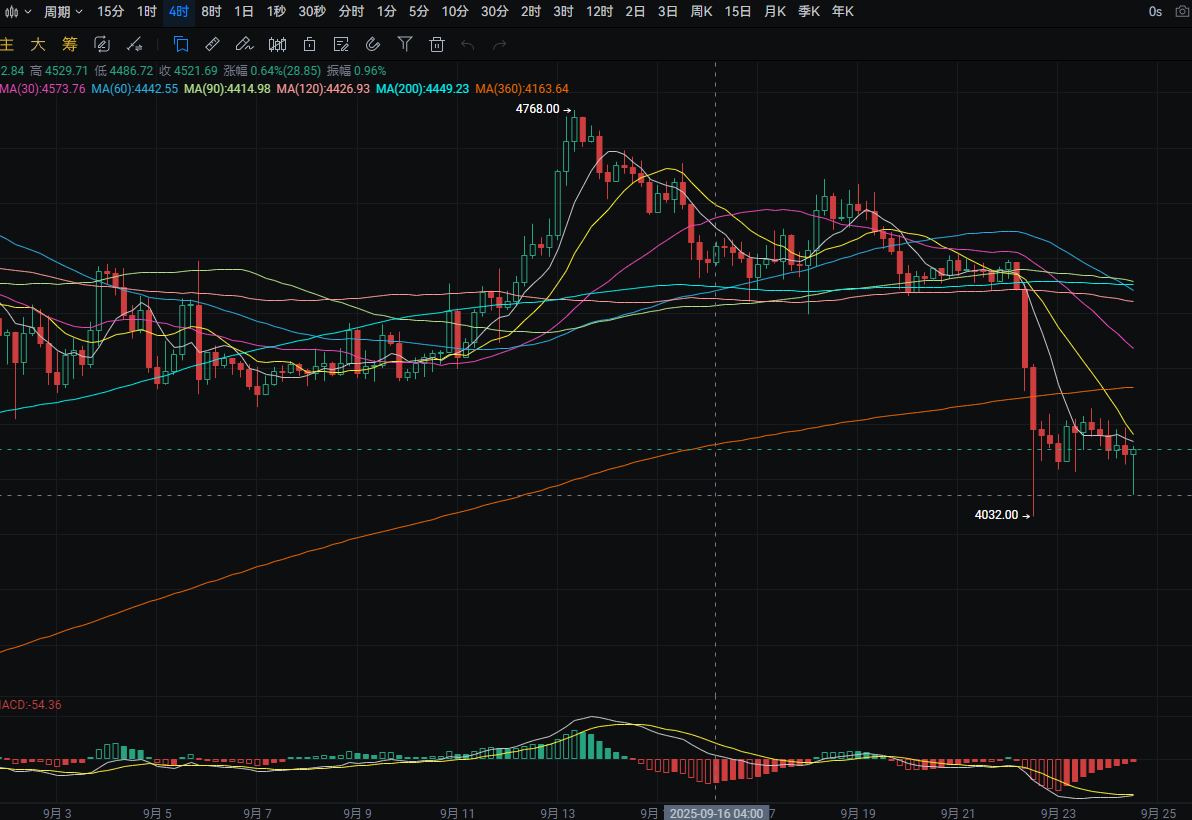
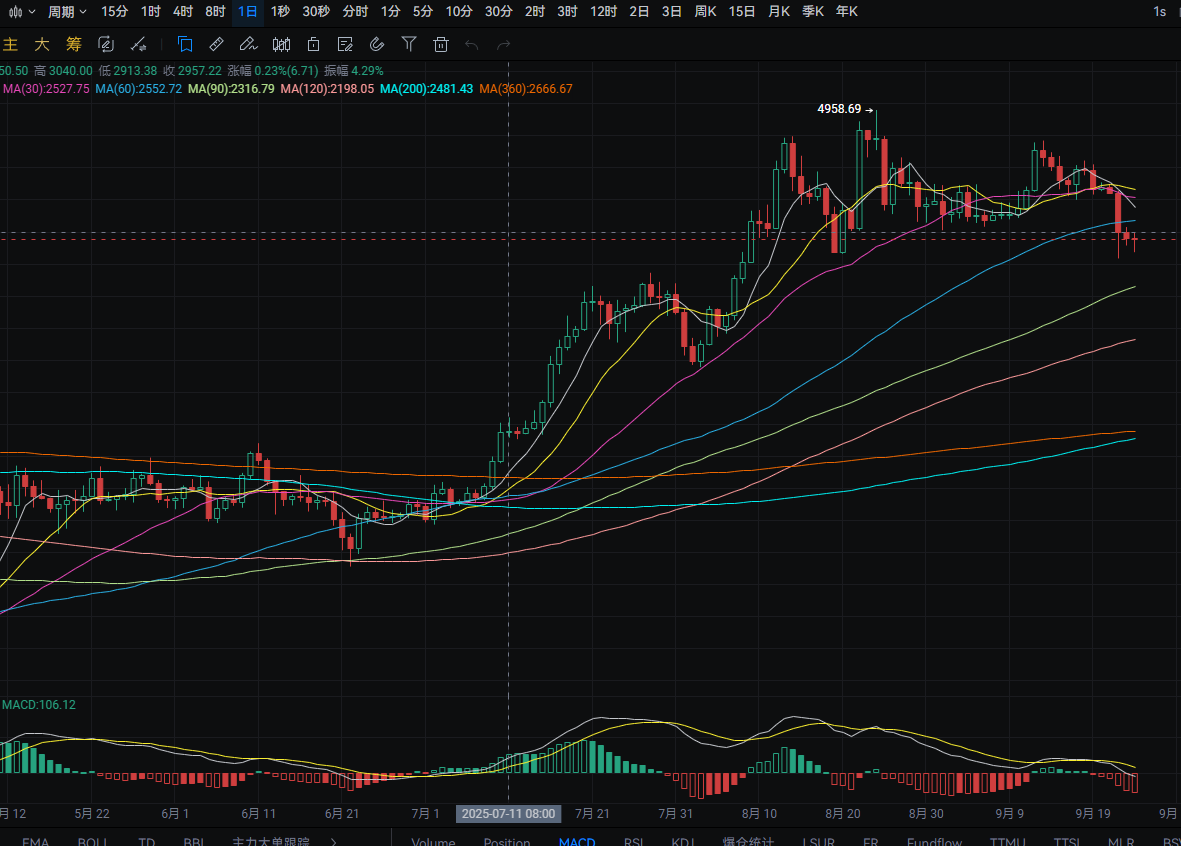
Ethereum's daily line fell from a high of around 4230 to a low of around 4115 yesterday, closing around 4160. The support level is around 4010; if it breaks, it could drop to around 3910. A pullback can be bought near this level. The resistance level is around MA60; if it breaks, it could rise to MA30. A rebound near this level can be sold short. MACD shows increasing bearish momentum. The four-hour support level is around 4050; if it breaks, it could drop to around 3955. A pullback can be bought near this level. The resistance level is around 4205; if it breaks, it could rise to MA30. A rebound near this level can be sold short. MACD shows decreasing bearish momentum.
Disclaimer: The above content is personal opinion and for reference only! It does not constitute specific operational advice and does not bear legal responsibility. Market conditions change rapidly, and the article has a certain lag. If you have any questions, feel free to consult.
免责声明:本文章仅代表作者个人观点,不代表本平台的立场和观点。本文章仅供信息分享,不构成对任何人的任何投资建议。用户与作者之间的任何争议,与本平台无关。如网页中刊载的文章或图片涉及侵权,请提供相关的权利证明和身份证明发送邮件到support@aicoin.com,本平台相关工作人员将会进行核查。


