Cryptocurrency News
September 17 Highlights:
1. Google releases AI payment protocol supporting stablecoins, collaborating with Coinbase and others.
2. The U.S. SEC delays its decision on the approval of the TRUTH SOCIAL spot Bitcoin ETF.
3. A dormant address was activated after 11.7 years, holding Bitcoin worth $117 million.
4. Movement Labs transforms into an L1 blockchain and launches Move 2.0.
5. LimeWire acquires the "Fyre Festival" brand, planning to relaunch in 2026 in cryptocurrency form.
Trading Insights
Share 4 hidden K-line signals from market makers to avoid 50% of pitfalls!
False Breakout: The "Previous High Trap" set by market makers ① Characteristics: Price quickly falls back after reaching the previous high, with trading volume shrinking compared to the average of the previous 3 days (rather than increasing), akin to "hanging a false light" to lure buyers. ② Key Distinction: A true breakout requires volume and price to move in sync, with volume at least 1.5 times the average of the previous 3 days; a false breakout only "touches" the previous high, with weak volume.
Yin-Yang "Washing Pin": Emotional manipulation by market makers Core observation: Support level (e.g., MA60) shows "Yin Pin + Yang Pin," signaling market makers testing panic selling; resistance level (e.g., previous high) shows "Yang Pin + Yin Pin," with the Yin Pin's volume increasing (e.g., 2 times), indicating a trap for buyers.
Long-term Consolidation: Market makers' "Hawk Waiting" accumulation technique ① Misconception: Consolidation is not a lack of movement, but a method for market makers to exhaust retail investors' patience, with direction often revealed at the end of consolidation. ② Technique: Consolidation lasting over 15 days leads to stronger breakouts; a true breakout requires simultaneous increase in volume and price, while a false breakout sees price rise with shrinking volume (market makers "drawing a door").
Sharp Top vs. Rounded Bottom: Signals of "Distribution" and "Accumulation" by market makers ① Sharp Top (Distribution): Rapid rise and fall form a "sharp knife" shape, often accompanied by massive volume (trading volume exceeding 3 times the usual), leaving little time to exit. ② Rounded Bottom (Accumulation): Slow grind and rise form a "rounded pot" shape, requiring low volume (trading volume reduced to below 50% of the average over the past 3 months).
Final Reminder: K-lines are the "footprints" of market makers; while these patterns are not 100% accurate, mastering them can help avoid at least half of unnecessary losses. Now, by opening the K-line chart for comparison, you can discover signals you may have missed. The cryptocurrency market is a game of hunters and prey; understanding the "subtext" can help you avoid being harvested and take more initiative.
LIFE IS LIKE
A JOURNEY ▲
Below are the real trading signals from the Big White Community this week. Congratulations to those who followed along; if your trades are not going well, you can come and test the waters.
Data is real, and each trade has a screenshot from the time it was sent.
**Search for the public account: *Big White Talks About Coins*
BTC
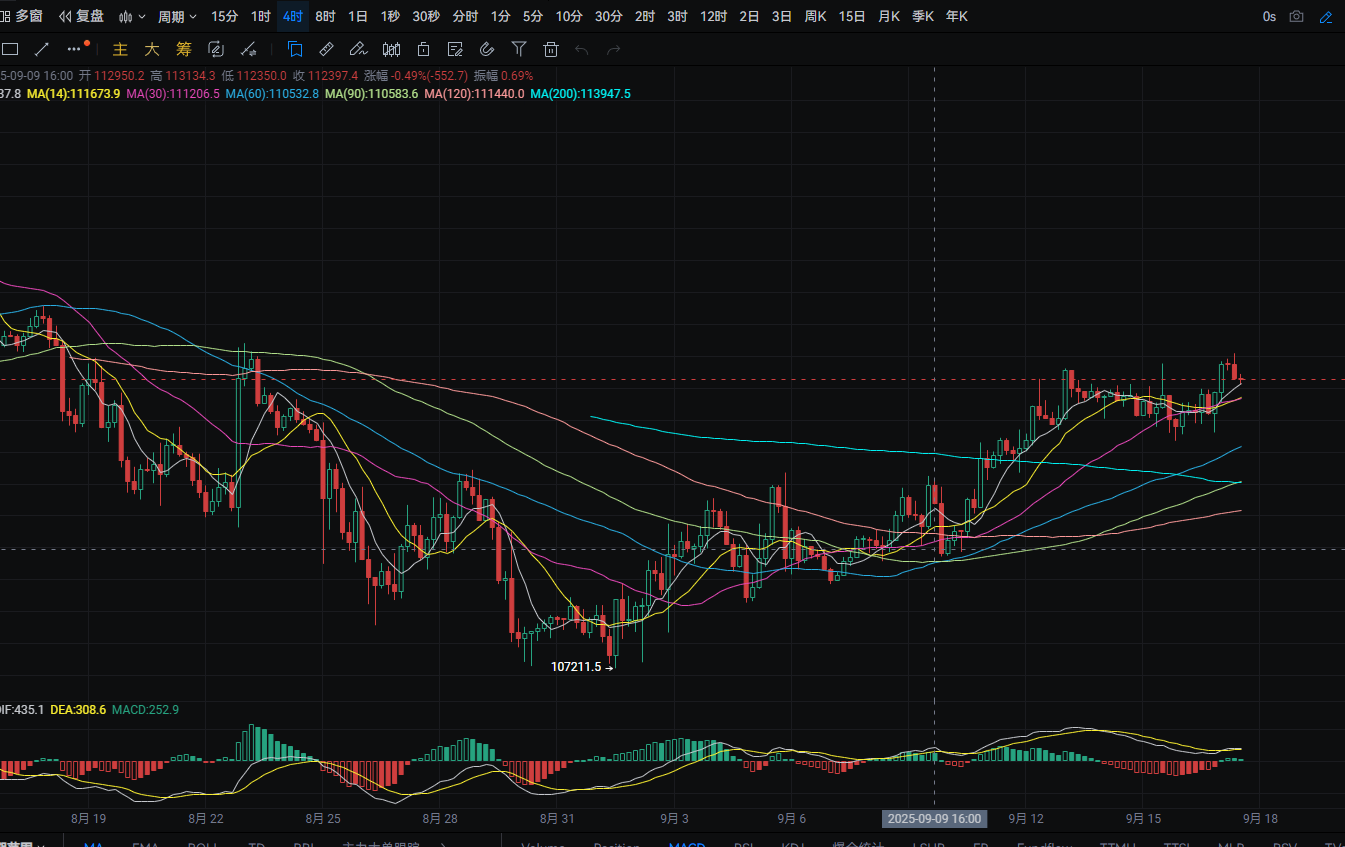
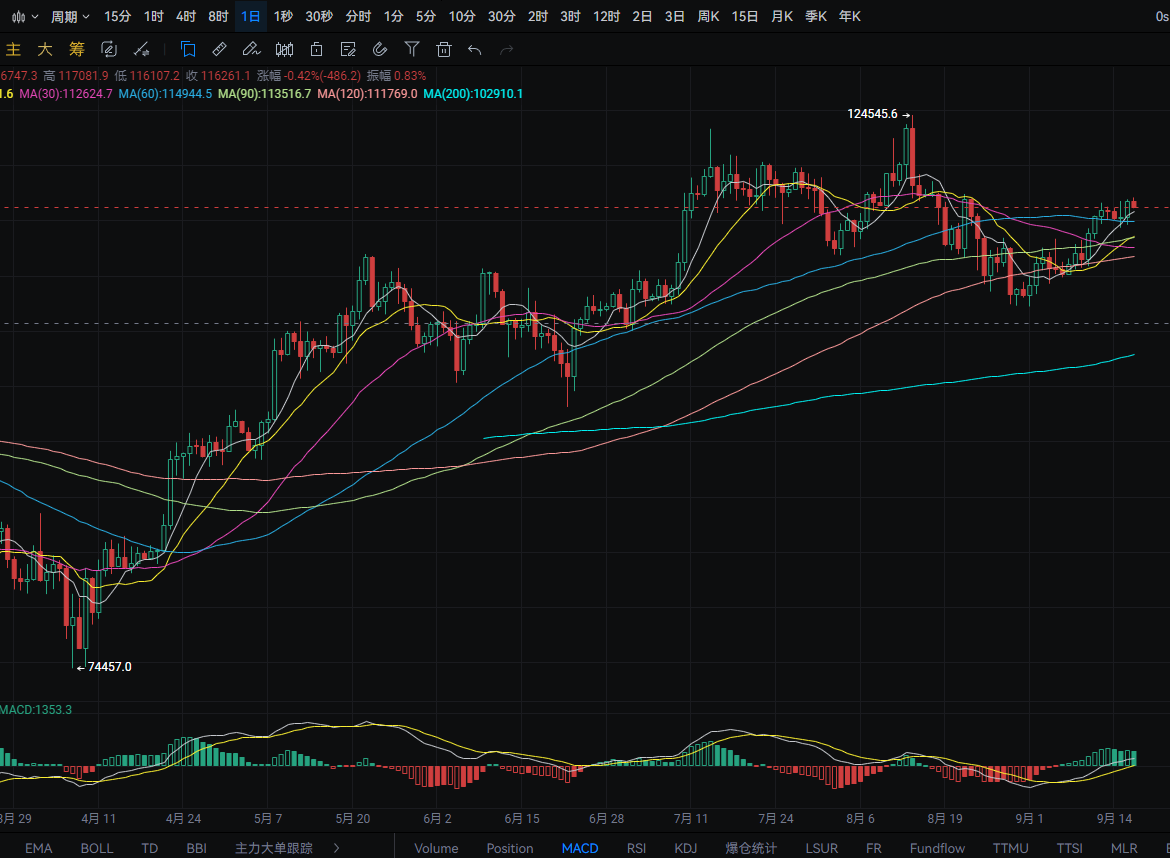
Analysis
Bitcoin's daily line rose from a low of around 114,600 to a high of around 116,900 yesterday, closing around 116,750. The support level is near MA60; if it breaks, it could drop to around MA30. A pullback can be bought near this level. The resistance level is around 118,750; if broken, it could rise to around 120,000. A rebound near this level can be sold short. MACD shows bullish momentum. The four-hour support level is near MA360; if broken, it could drop to around MA30. A pullback can be bought near this level. The resistance level is around 117,600; if broken, it could rise to around 118,950. A rebound near this level can be sold short. MACD shows bullish momentum.
ETH
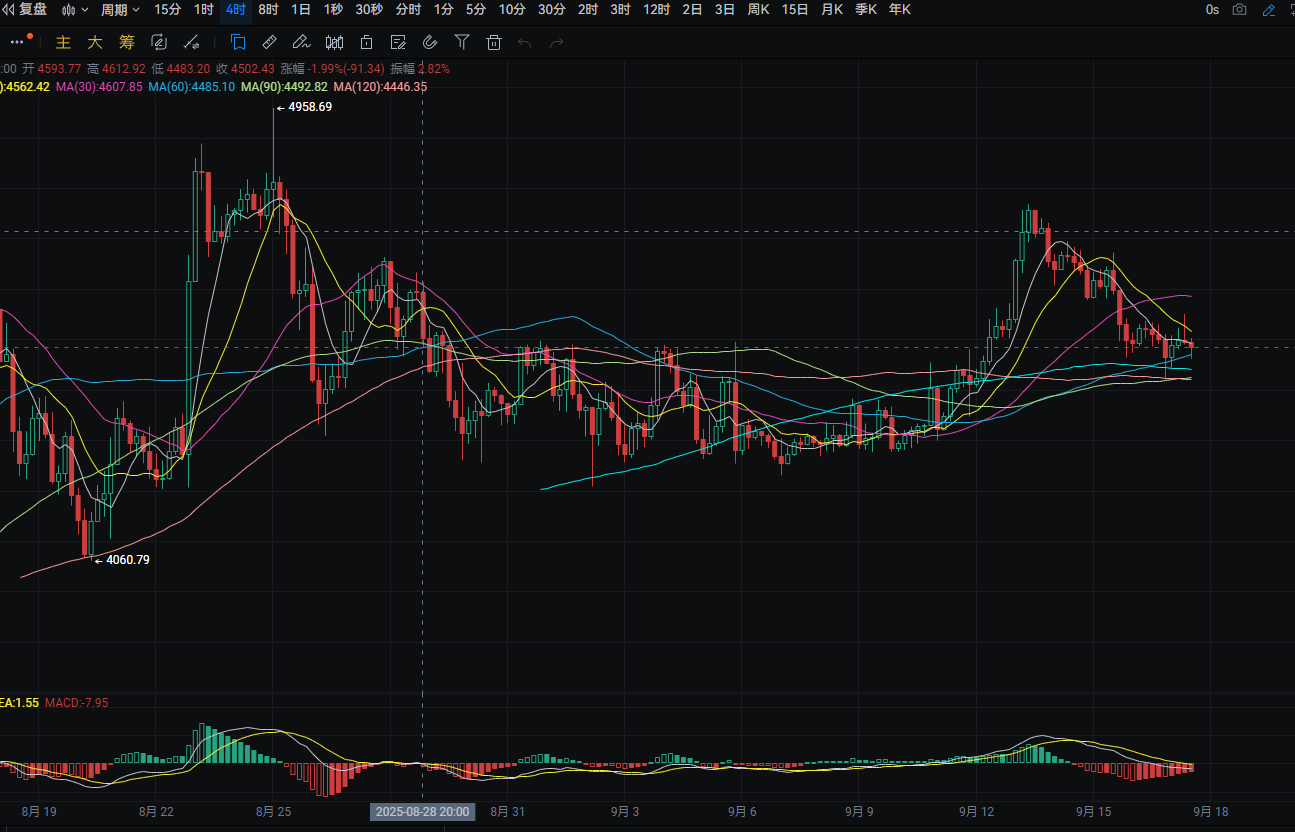
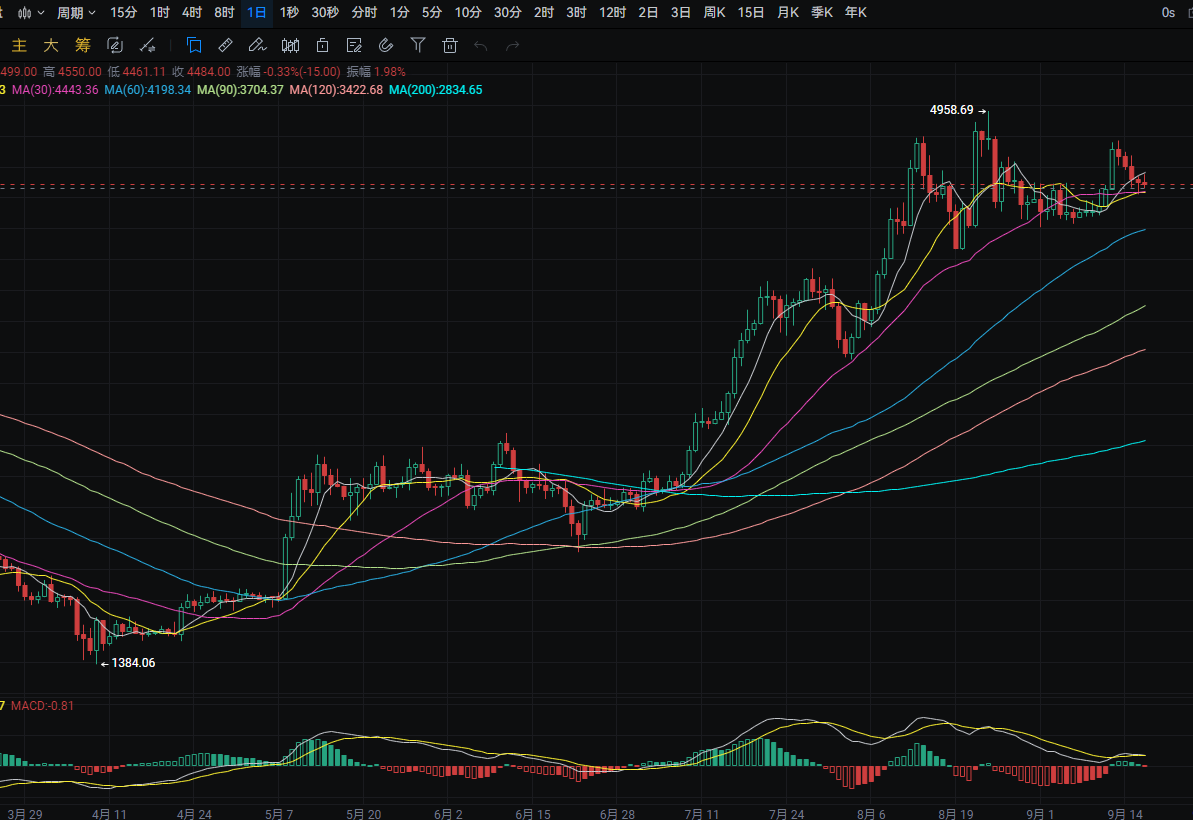
Analysis
Ethereum's daily line fell from a high of around 4,535 to around 4,420 yesterday, closing around 4,500. The support level is near 4,395; if broken, it could drop to around 4,285. A pullback can be bought near this level. The resistance level is around 4,665; if broken, it could rise to around 4,835. A rebound near this level can be sold short. MACD shows decreasing bullish momentum with dual lines converging. The four-hour support level is near MA120; if broken, it could drop to around 4,365. A pullback can be bought near this level. The resistance level is around 4,545; if broken, it could rise to around MA30. A rebound near this level can be sold short. MACD shows decreasing bearish momentum.
Disclaimer: The above content is personal opinion and for reference only! It does not constitute specific operational advice and does not bear legal responsibility. Market conditions change rapidly, and the article may have some lag; if you have any questions, feel free to consult.
免责声明:本文章仅代表作者个人观点,不代表本平台的立场和观点。本文章仅供信息分享,不构成对任何人的任何投资建议。用户与作者之间的任何争议,与本平台无关。如网页中刊载的文章或图片涉及侵权,请提供相关的权利证明和身份证明发送邮件到support@aicoin.com,本平台相关工作人员将会进行核查。


