
投资者押注美联储将在9月重启降息,届时距离2024年12月的上次降息已过去9个月。分析师表示,如此长时间的政策停滞期或对股市格外有利好作用,可能延长并扩大股市涨势。
在过去11次美联储暂停5至12个月后再次降息的案例中,有10次标普500指数在降息后的一年内均出现上涨。
芝商所显示降息50%的概率10%,降息25%概率90%,尽管全球债券市场遭受抛售压力,多国长期债券收益率大幅飙升。美国 30 年期国债收益率升至 5% ,日本 30 年期国债收益率创历史新高,德、英、法等国 30 年期国债收益率也分别升至多年来的最高水平。
黄金继续创出新高3631,距离前高3499已经拉了132点,也就一个星期左右时间。
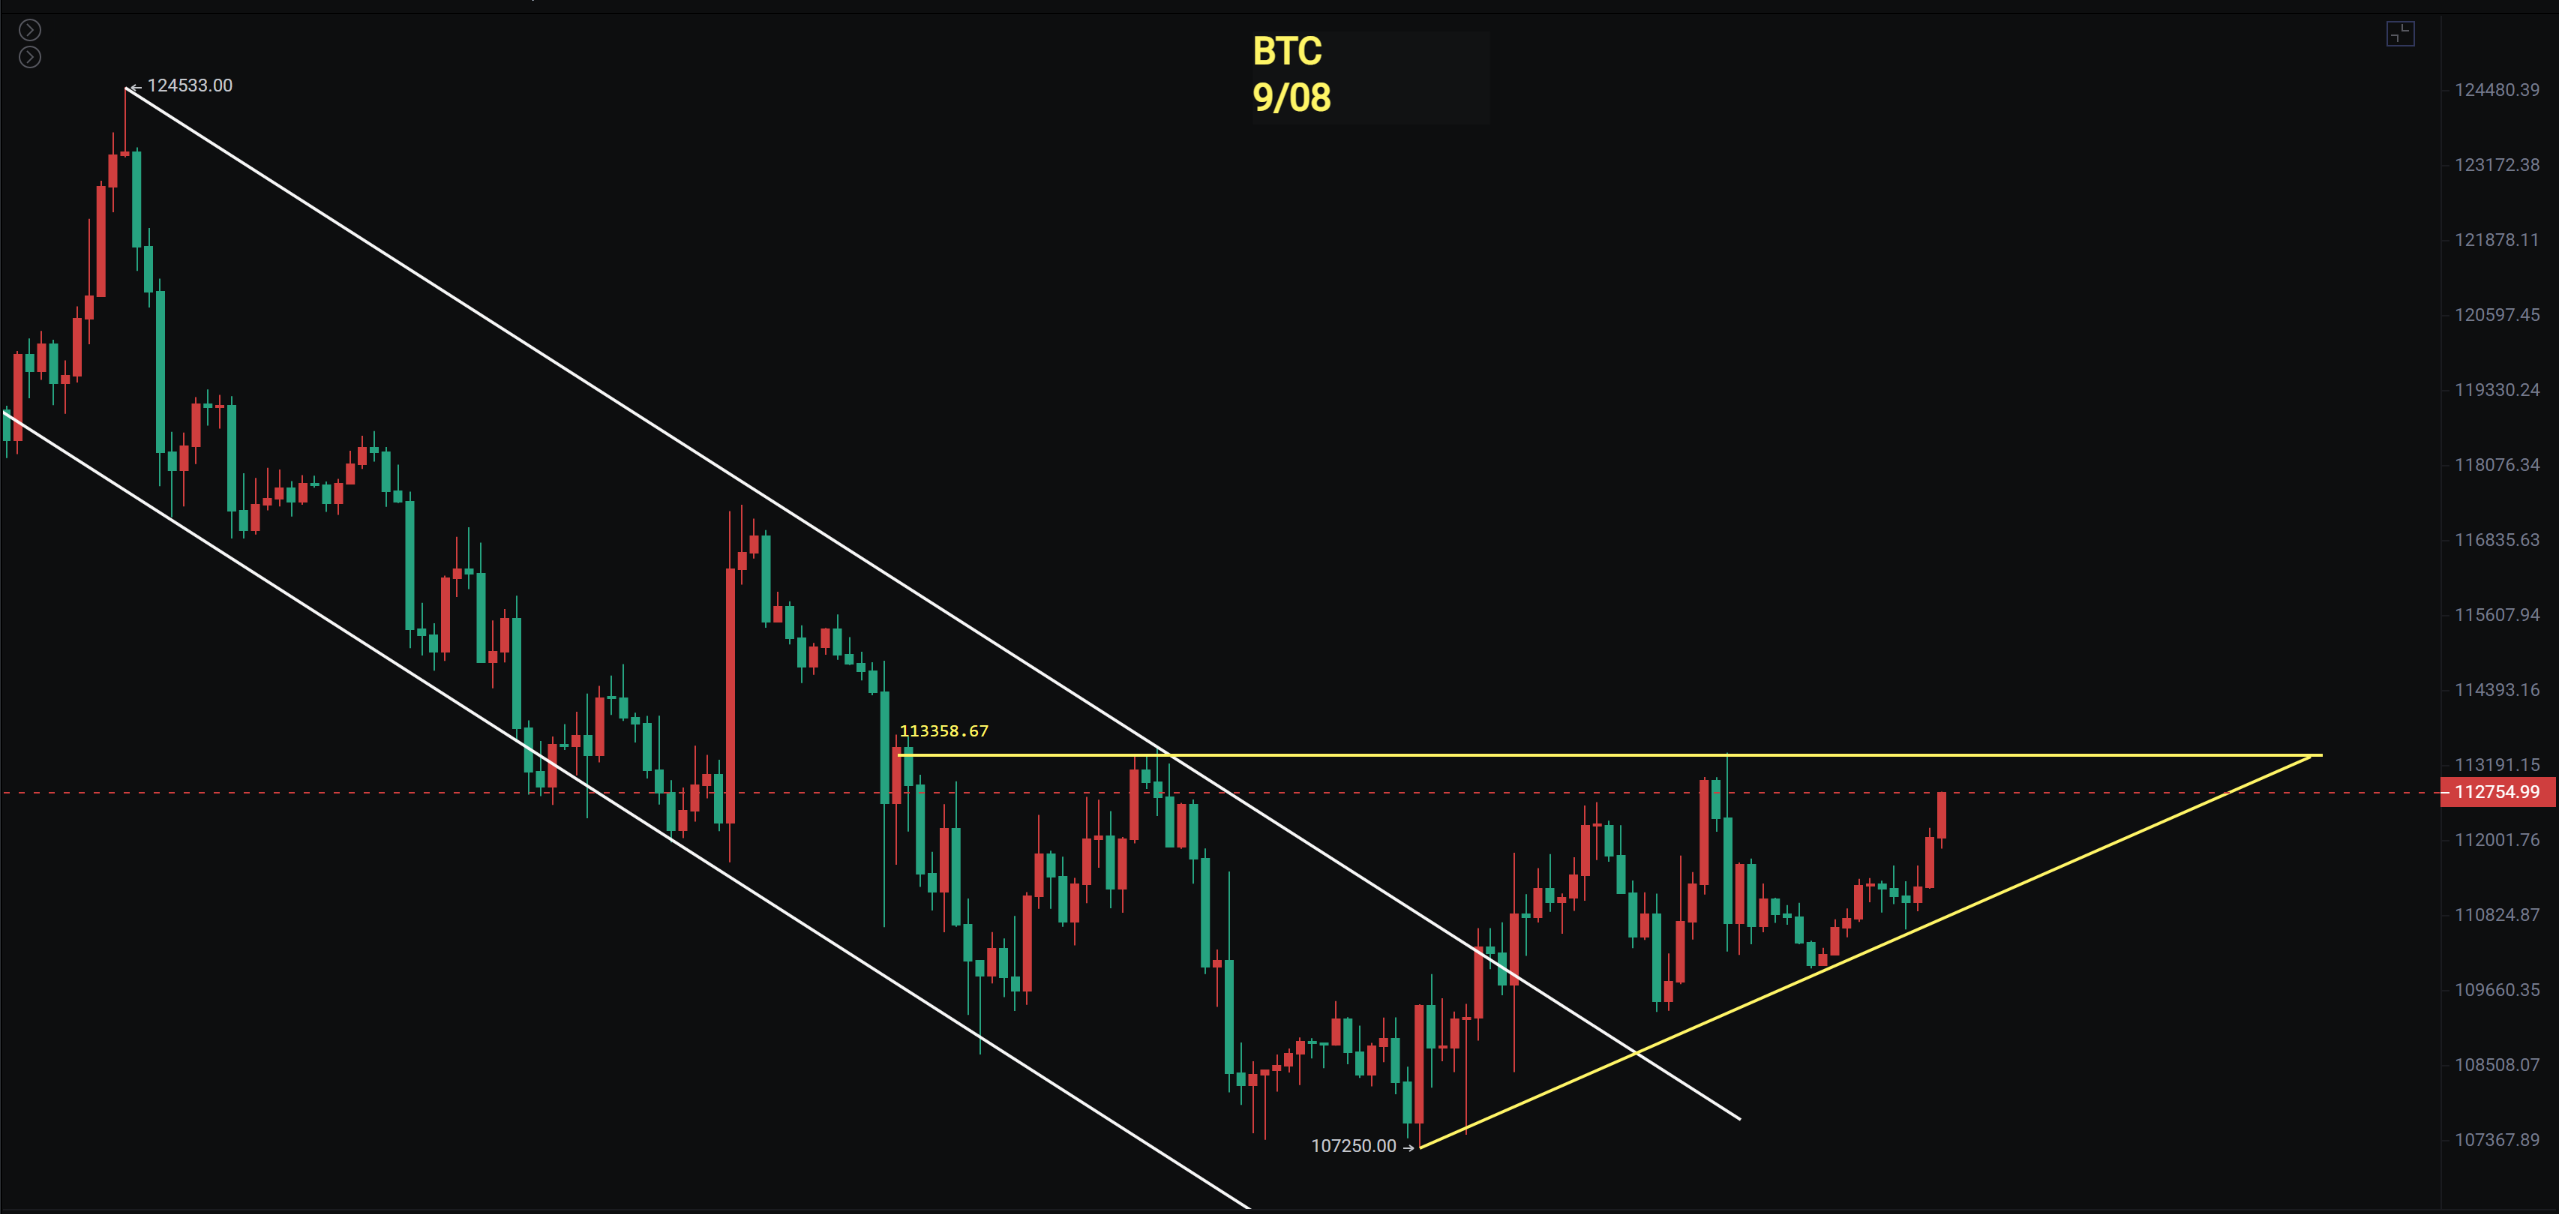
大饼
大饼的价格站上了MA120和MA20,下一个压力就是113500和115400,短线继续看反弹上周公子提醒4小时走了头肩底形态,向上插针113344后快速的回落继续走反弹,日线这里也走出了一个上升的三角压力在113500,日线MACD在零轴上方快慢线交叉短线继续看反弹。
上周周线收线向上插针113500下方,但是本周开盘继续线上反弹如果价格能收回到113500上方还是比较的乐观,还有九天的时间,要留意降息后大饼的回调幅度。
支撑:107211一109200
压力:113500一115400一117400
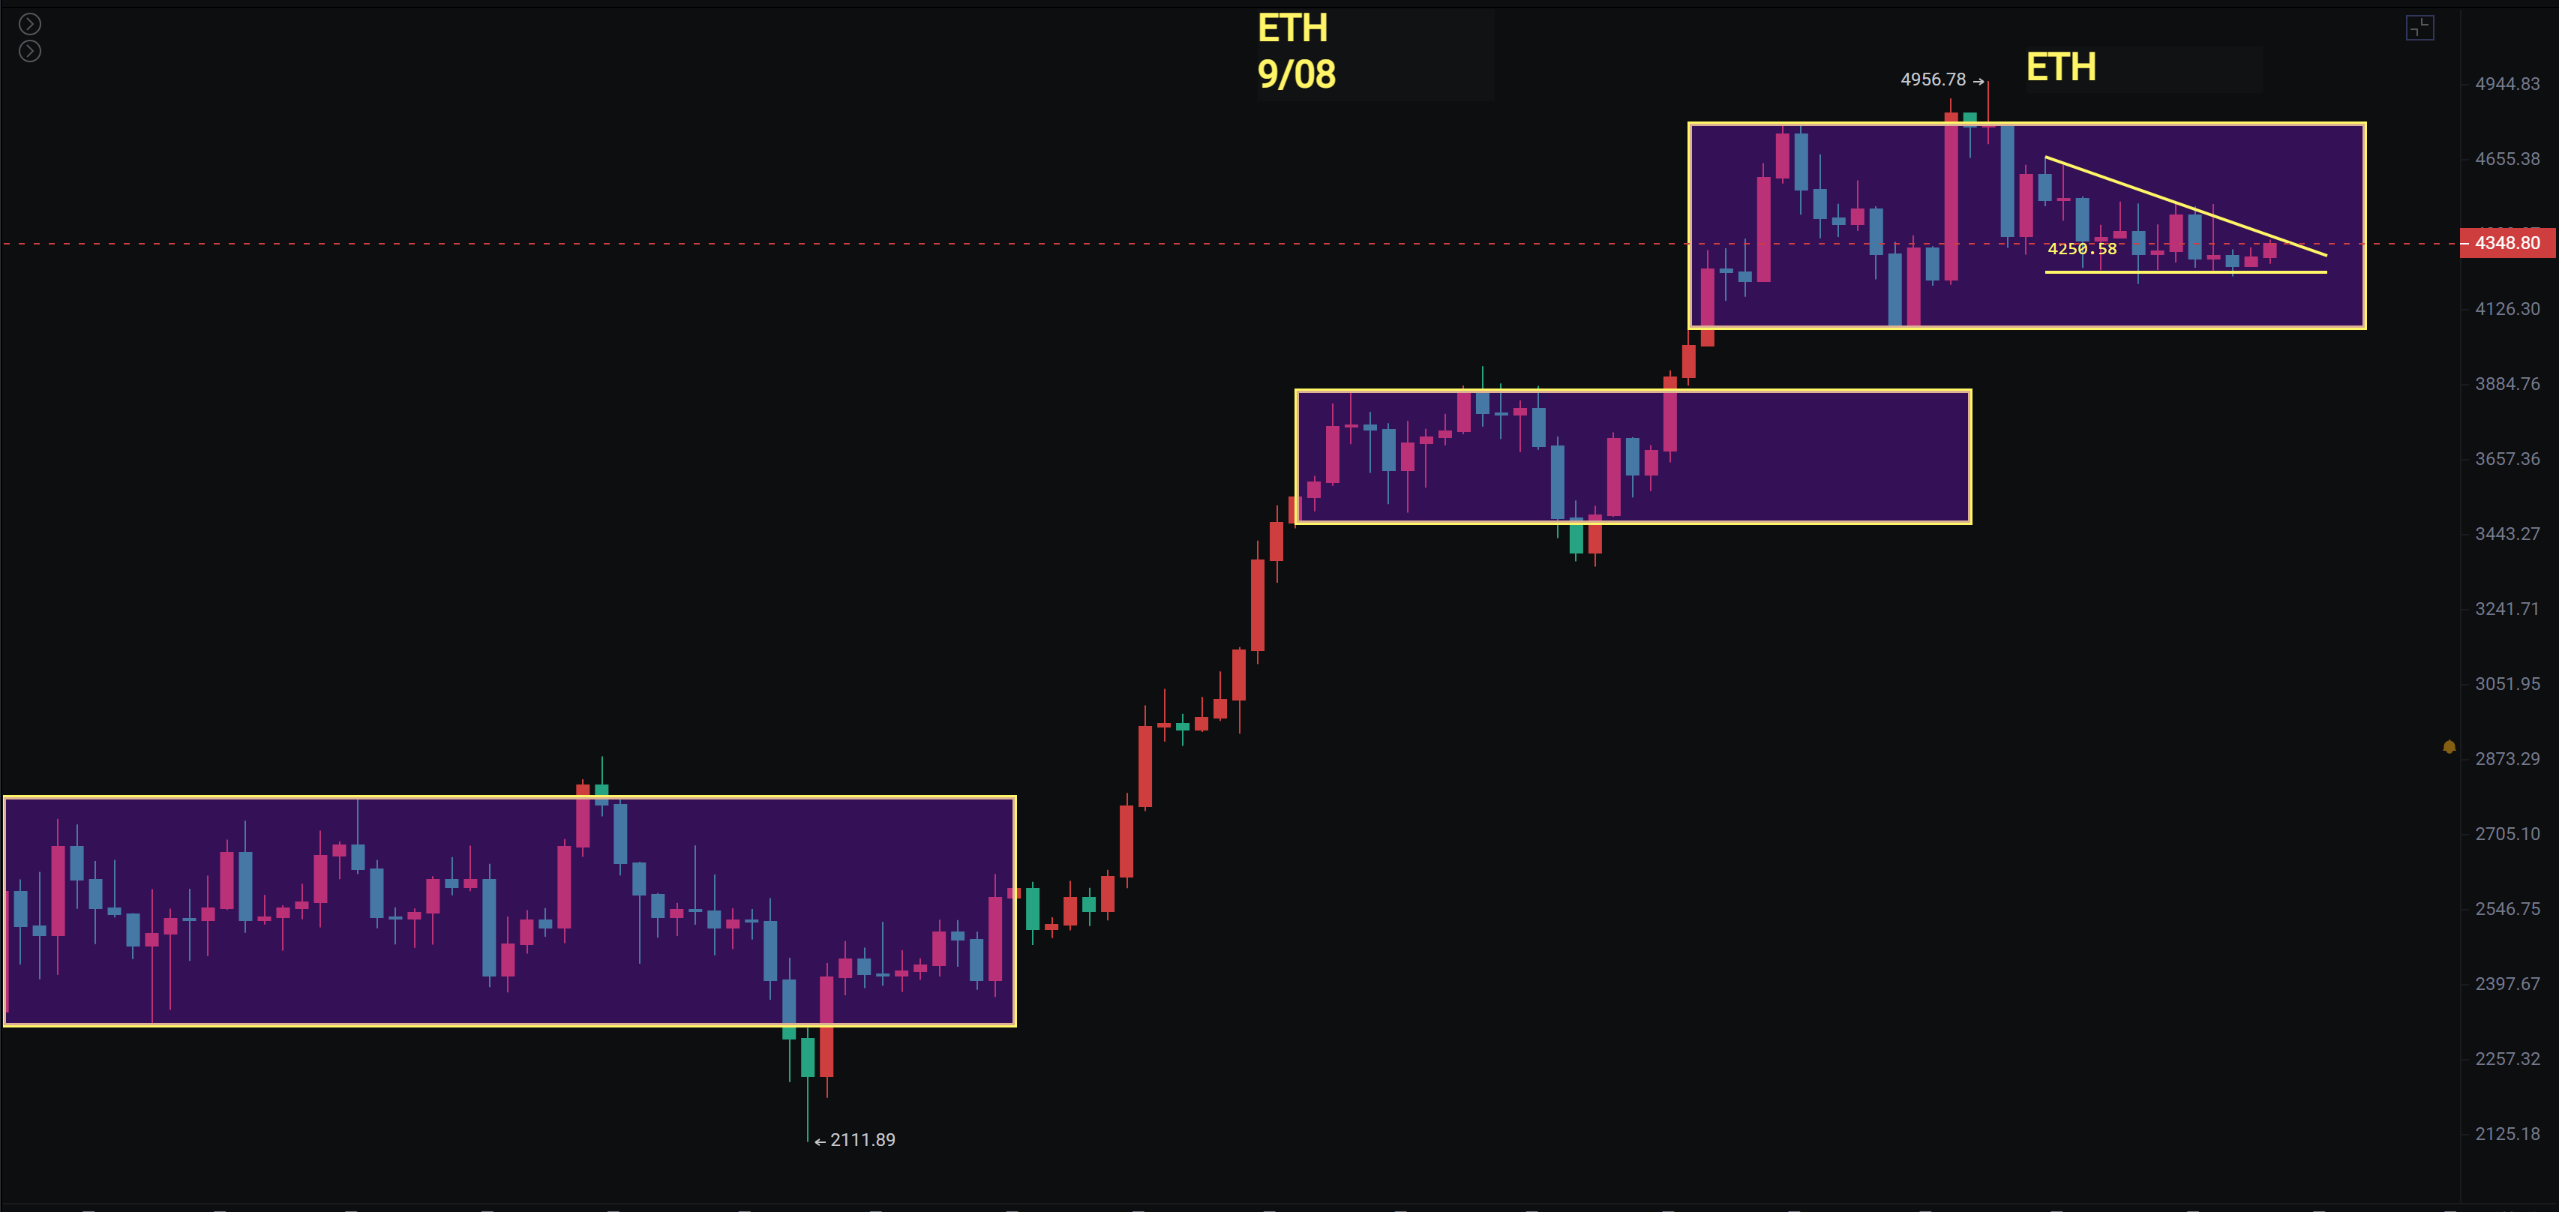
以太
以太的周线虽然收阴但是还不能完全算是吞没,没有跌破4060的低点日线已经连续的十几天的窄幅震荡,短线的反弹高度有限,仍然可以等待一笔不错的回调之后的上车机会。
以太4小时的高点在不断地降低,但是支撑在4200附近又是比较明显,一直维持在箱体内部震荡,暂时只能头仓,反而不少山寨走出来不错的买点机会。
支撑:3850一4060
压力:4500一4788一4956
你喜欢我的观点,请点赞评论分享,我们一起穿越牛熊!!!
文章具有时效性,仅供参考实时更新
专注k线技术研究,共赢全球投资机会公众号:BTC交易公子扶苏

免责声明:本文章仅代表作者个人观点,不代表本平台的立场和观点。本文章仅供信息分享,不构成对任何人的任何投资建议。用户与作者之间的任何争议,与本平台无关。如网页中刊载的文章或图片涉及侵权,请提供相关的权利证明和身份证明发送邮件到support@aicoin.com,本平台相关工作人员将会进行核查。


