币圈资讯
9月5日热点;
1.彭博行业研究分析师称:REX-Osprey 准备下周将首个 Dogecoin ETF 推向市场
2.Solana treasury DeFi Development 的持有量超过 200 万 SOL
3.Jito基金会宣布已完成价值100万美元的JTO初始回购计划
4.美联储理事会提名人米兰:美联储的独立性对经济至关重要
5.以太坊的月度现货交易量在中心化交易所上首次超过 Bitcoin 交易量,为 7 年多来首次
交易心得
分享4个庄家暗藏的K线暗号,看懂少踩50%坑! 1、假突破:庄家设下的“前高陷阱” ① 特征:价格触及前高后快速回落,成交量较前3日均值萎缩(而非放大),如同“挂假灯”诱多。② 关键区分:真突破需量价同步,量能至少达前3日均值1.5倍;假突破仅“碰”前高,量能萎靡。2、阴阳“洗盘针”:庄家的情绪操控 核心看位置:支撑位(如MA60)出现“阴针+阳针”,是庄家测试恐慌盘的洗盘信号;压力位(如前高)出现“阳针+阴针”,且阴针量能放大(如2倍),则是诱多出货。3、长期横盘:庄家的“熬鹰”吸筹术 ① 误区:横盘非无行情,而是庄家耗散散户耐心的手段,方向往往在横盘结束时显现。② 技巧:横盘超15天,突破后力度更强;真突破需量价齐升,假突破则价涨量缩(庄家“画门”)。4、尖顶vs圆底:庄家的“出货”与“吸筹”信号 ① 尖顶(出货):急拉急跌呈“尖刀”状,常伴随天量(成交量达平日3倍以上),让人来不及离场。② 圆底(吸筹):慢磨慢涨呈“圆锅”状,需配合地量(成交量缩至前3月均值50%以下)。最后提醒: K线是庄家的“脚印”,这些形态虽非100%准确,但掌握后至少能规避一半不必要的亏损。如今打开K线图对照,便能发现曾错过的信号。币圈是猎人与猎物的游戏,看懂“潜台词”,才能少被收割、多握主动。
LIFE IS LIKE
A JOURNEY ▲
下方是大白社区本周实盘群单子,恭喜跟上的币友,如果你操作不顺,可以来试试水。
数据真实,每一单都有当时发出的截图。
搜索公众号:大白论币
BTC
分析
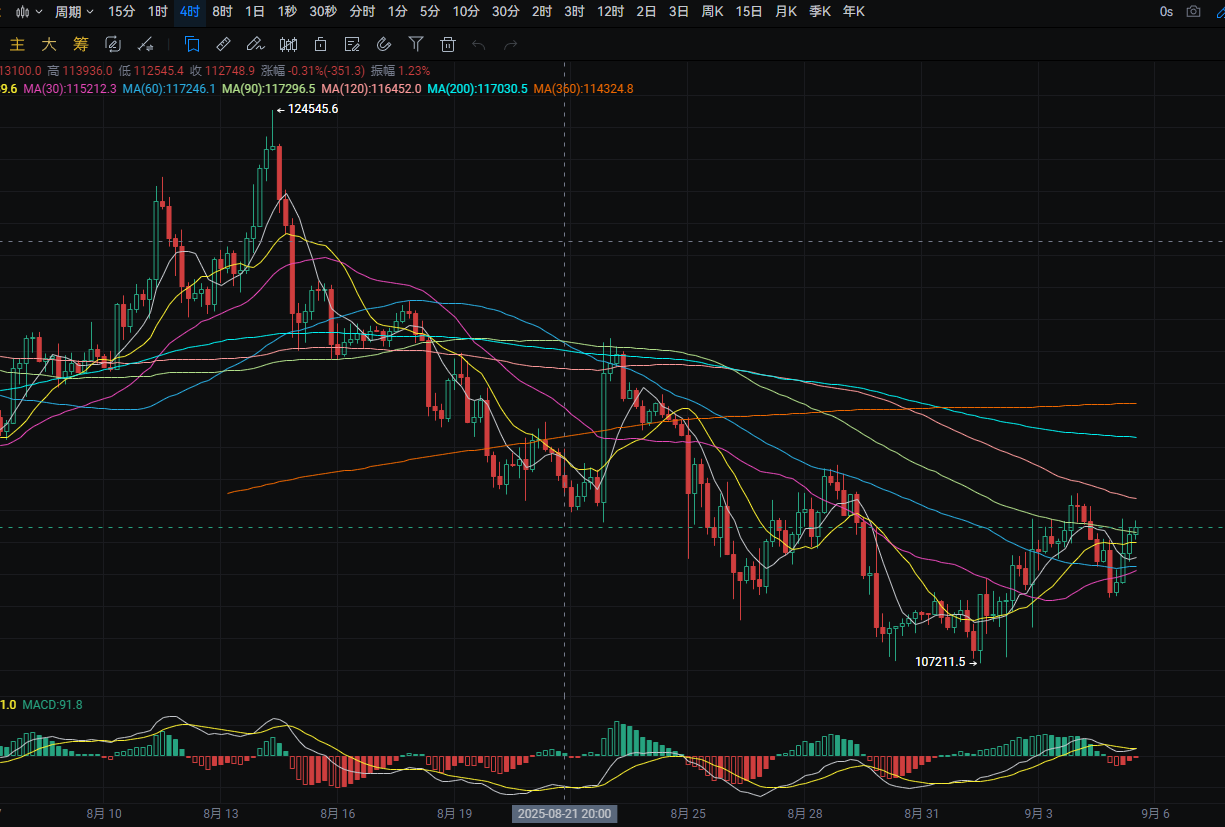
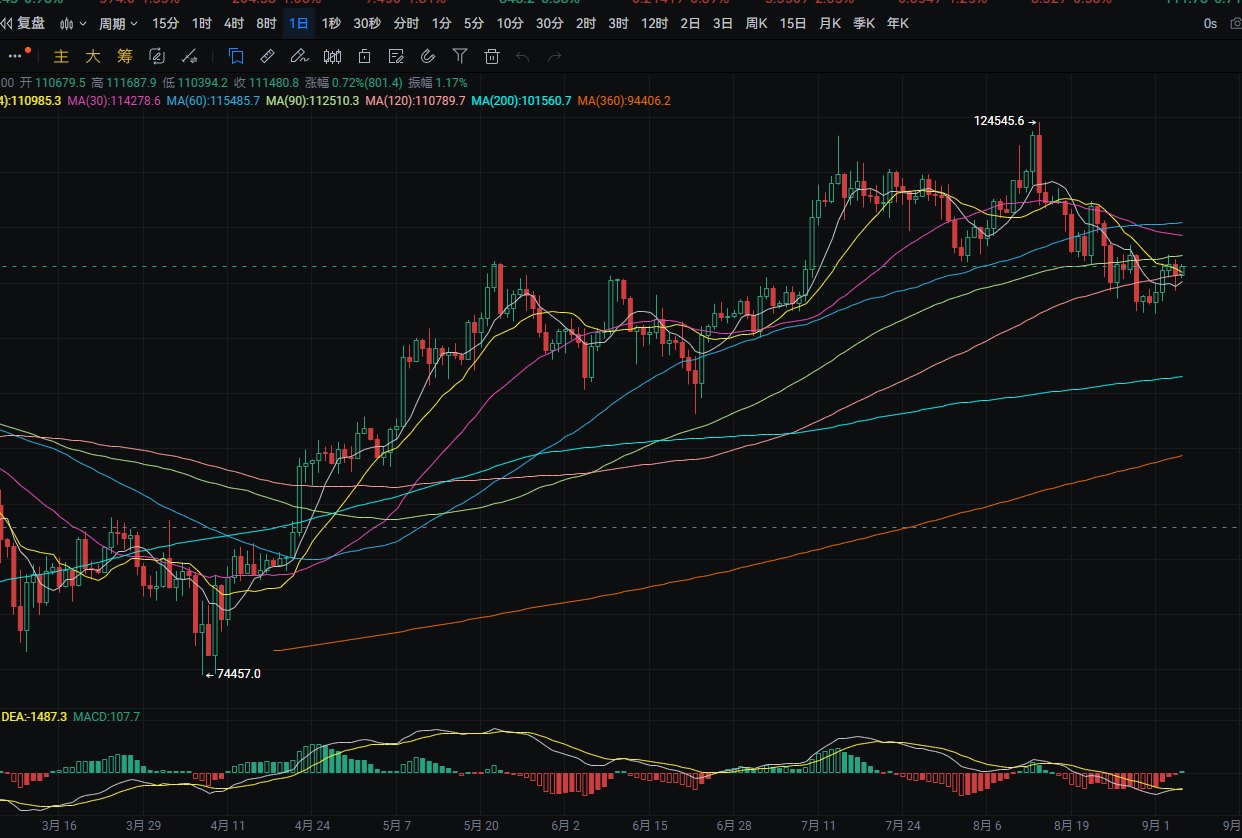
大饼日线昨日从最高112150附近下跌至最低109250附近 收线在110700附近 下方支撑位于108250附近 跌破则可看至105150附近 回踩可在附近进行接多 上方压力位于MA90附近 突破则可看至MA30附近 反弹至附近可进行接空 MACD空头缩量 有形成金叉的迹象 四小时下方支撑位于MA30附近 跌破则可看至107650附近 回踩可在附近进行接多 上方压力位于MA120附近 突破则可看至MA200附近 反弹至附近可进行接空 MACD空头缩量
ETH
分析
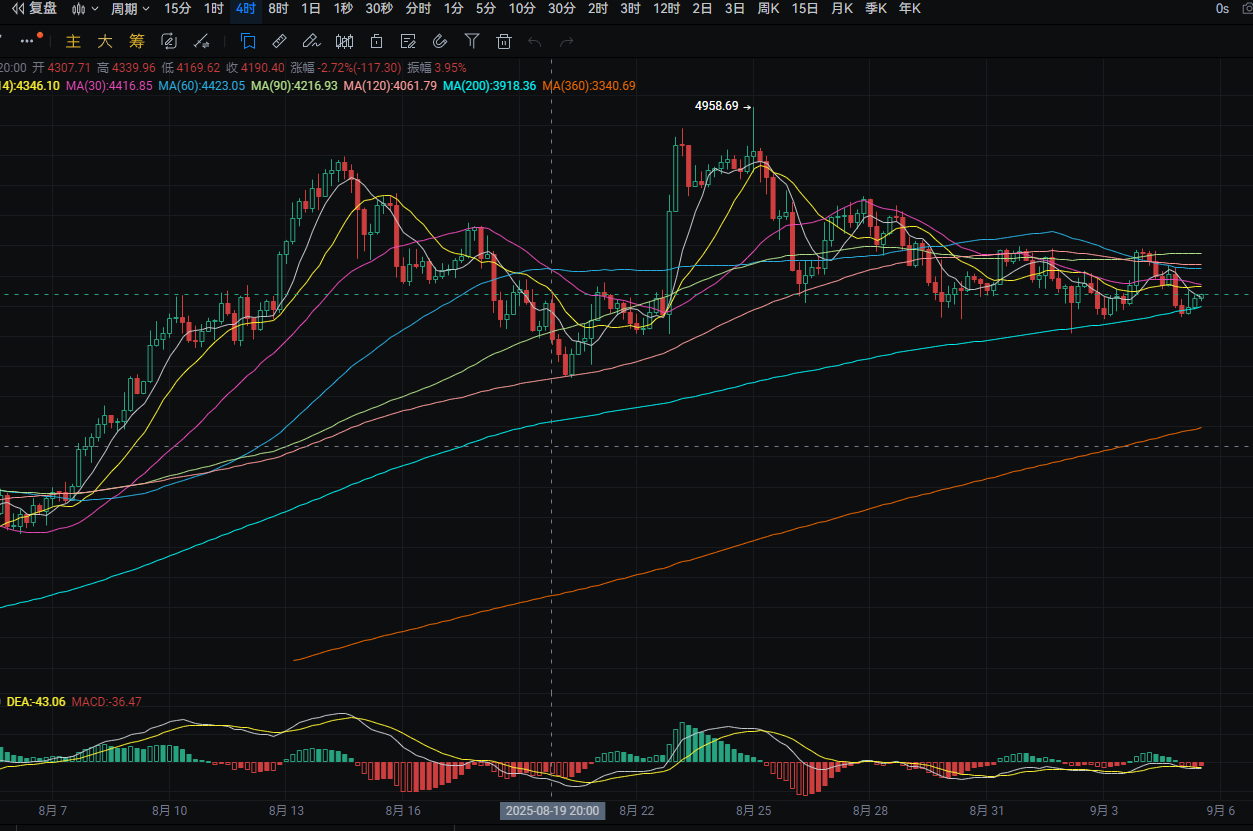
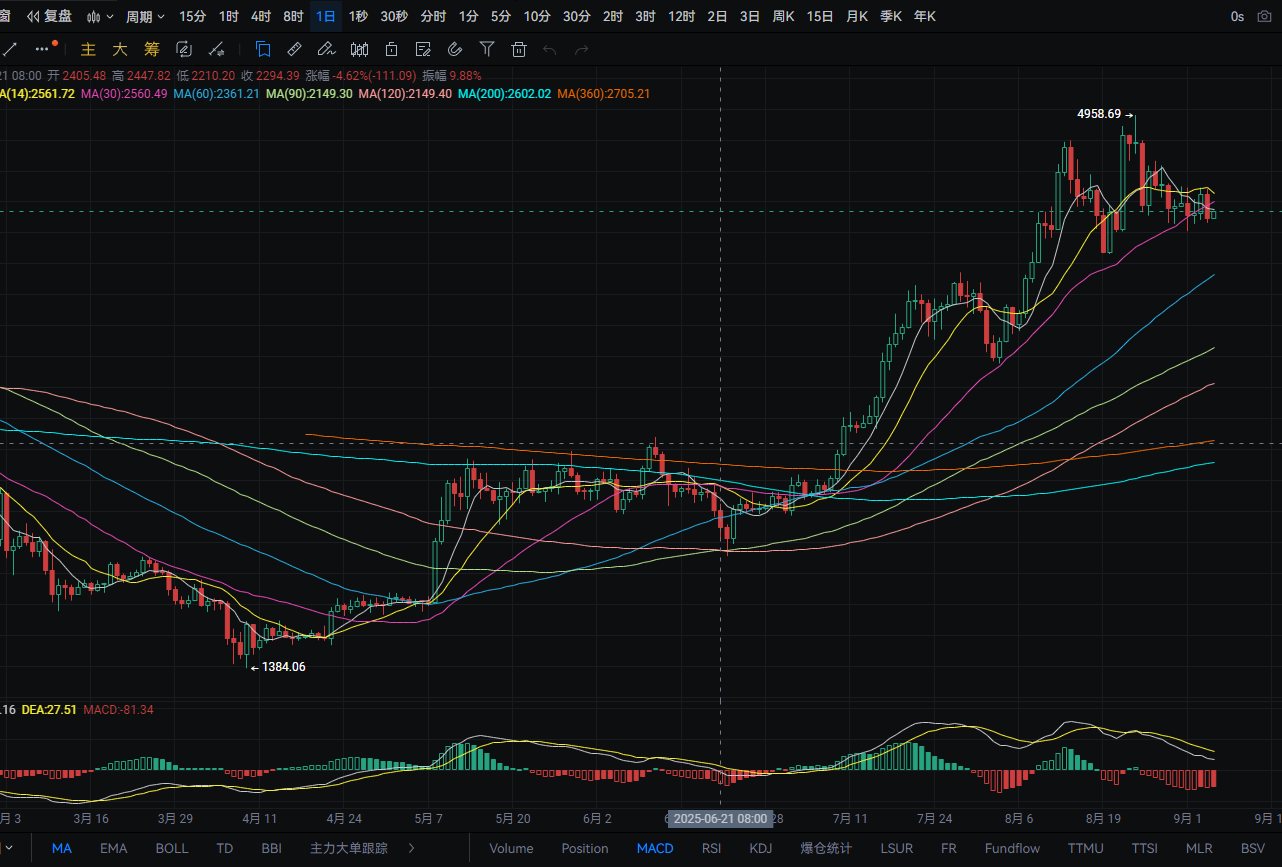
以太日线昨日从最高4480附近下跌至最低4260附近 收线在4295附近 下方支撑位于4265附近 跌破则可看至4075附近 回踩可在附近进行接多 上方压力位于MA14附近 突破则可看至4590附近 反弹至附近可进行接空 MACD空头增量 四小时下方支撑位于MA200附近 跌破则可看至4140附近 回踩可在附近进行接多 上方压力位于MA60附近 突破则可看至MA90附近 反弹至附近可进行接空 MACD震荡走平
免责声明:以上内容均为个人观点,仅供参考!不构成具体操作建议,也不负法律责任。市场行情瞬息万变,文章具有一定滞后性,如果有什么不懂的地方,欢迎咨询
免责声明:本文章仅代表作者个人观点,不代表本平台的立场和观点。本文章仅供信息分享,不构成对任何人的任何投资建议。用户与作者之间的任何争议,与本平台无关。如网页中刊载的文章或图片涉及侵权,请提供相关的权利证明和身份证明发送邮件到support@aicoin.com,本平台相关工作人员将会进行核查。


