
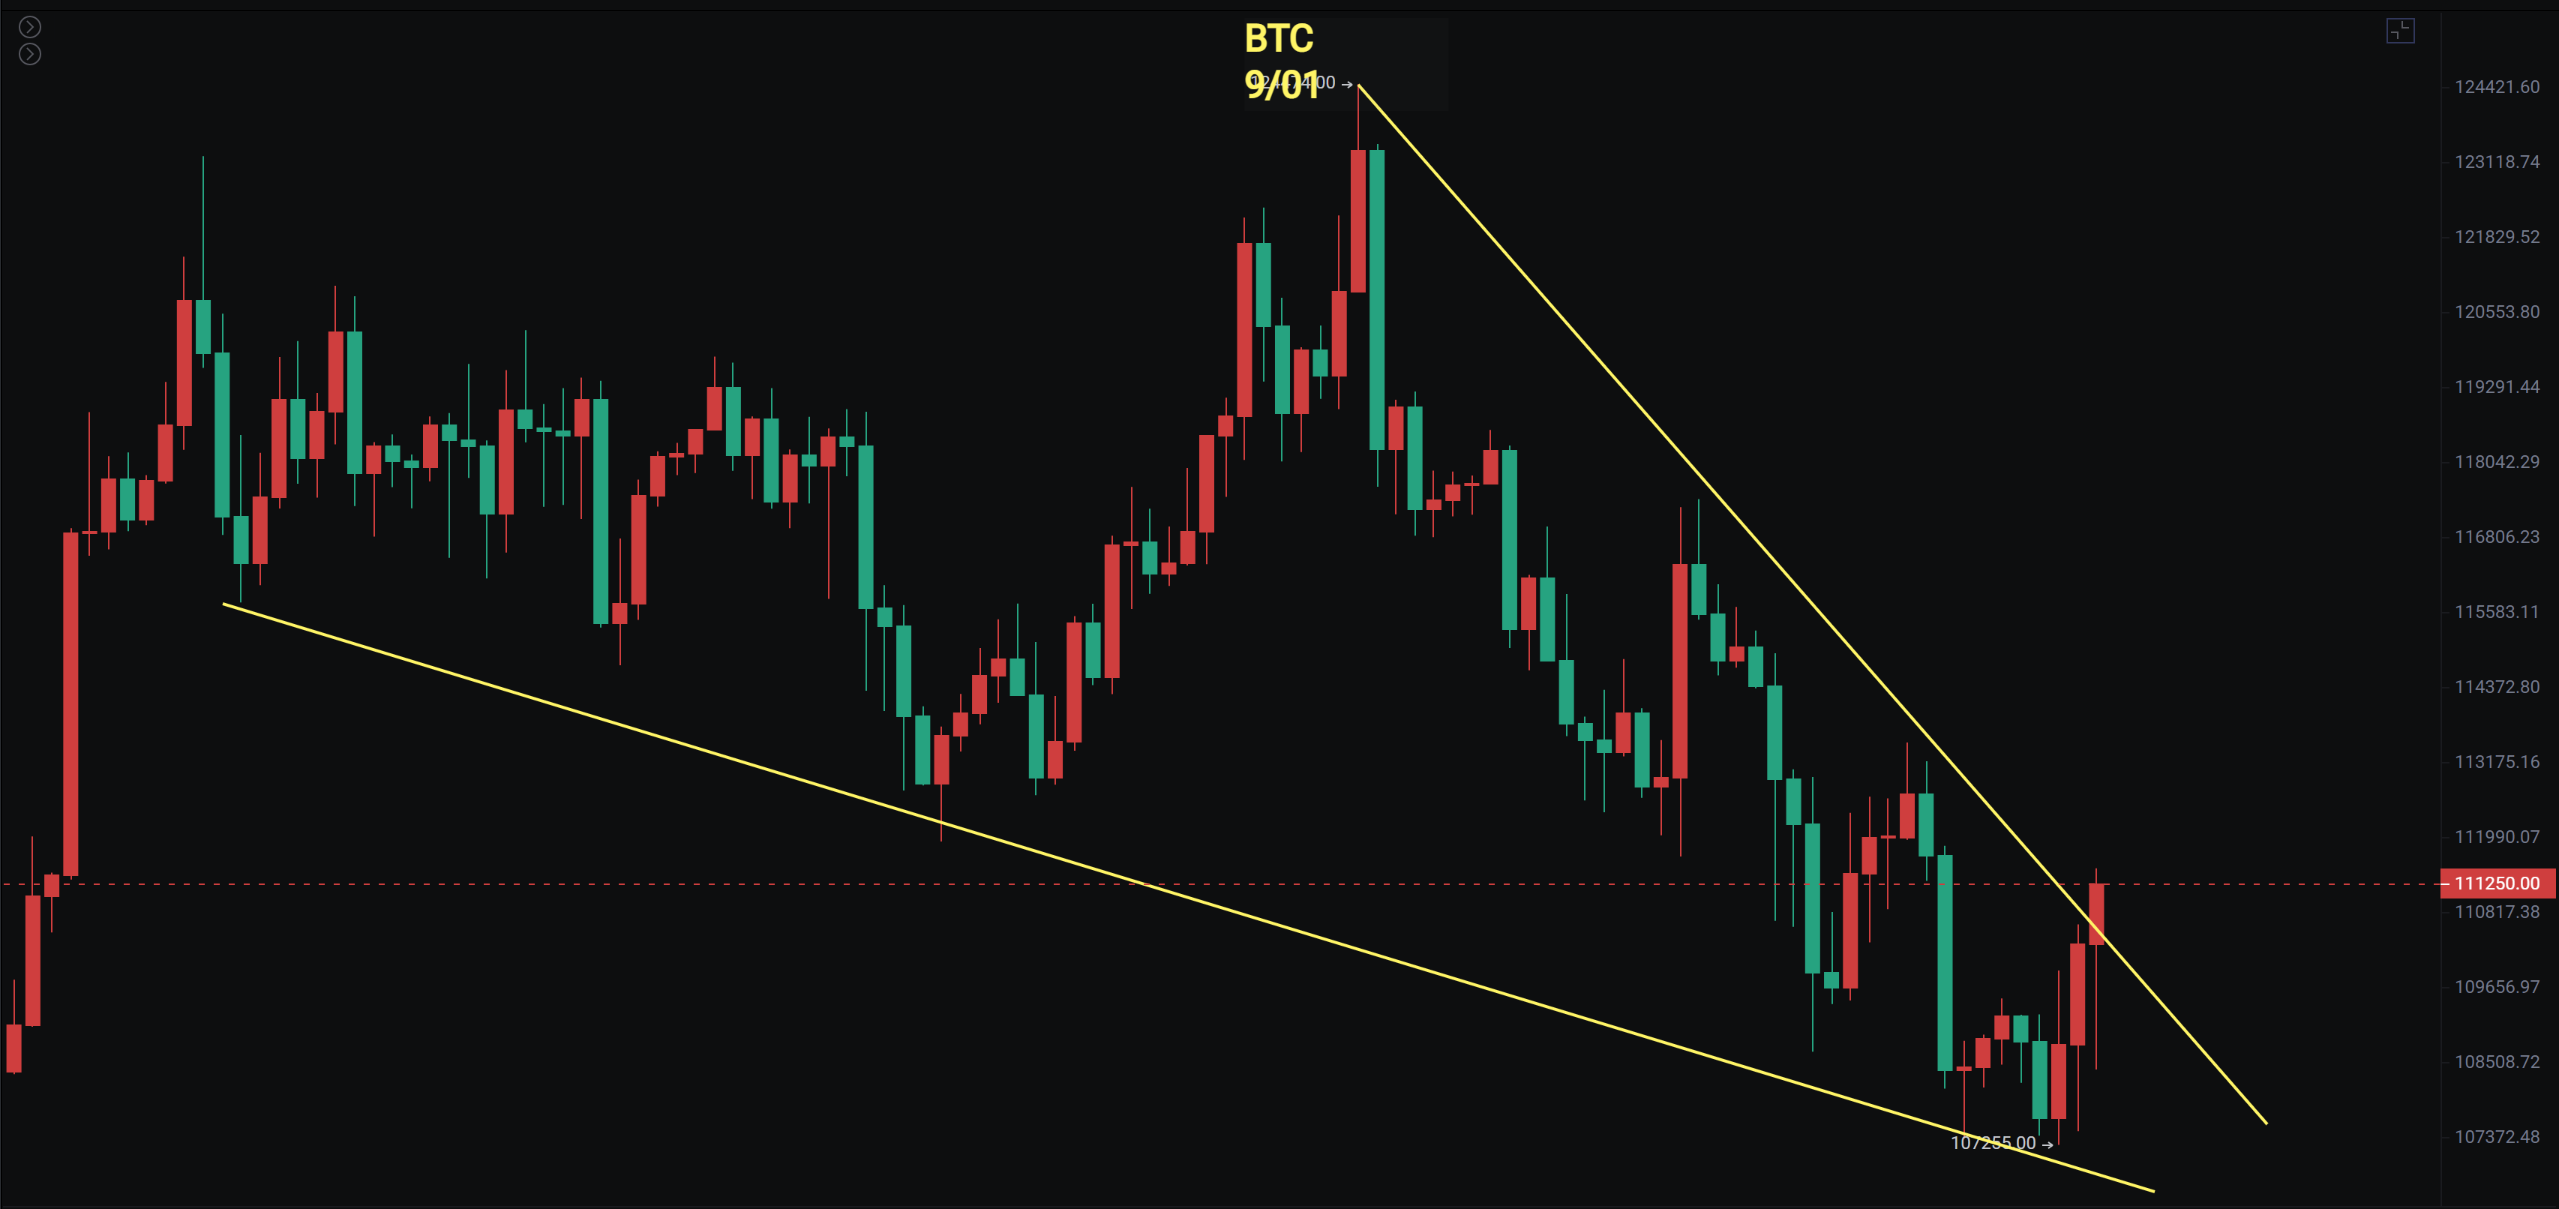
大饼再次在107200附近插针反弹最高触及110700短线继续回调,公子之前说跌破M A120如果接下来两到三天不能快速的占回二零上方后续会加速下跌,今天是跌破的第四天向上插针触及MA120,关注能否站上昨天的分析里面也提醒短线看反弹上方的压力是112000至113500。
以太昨晚插针至4205线上反弹日线第四天跌破MA20,BTC D(总市值占比)日线是走出了底背离,同时有一个下降楔形短期有反弹的需求,同时ETH/BTC汇率回踩MA20,也是出现了顶背离,所以鉴于这种情况资金回流比特币拉升的话,以太和山寨短期有回调趋势,包括可以看到昨晚以太稍微插针山寨又跌不少。
黄金插针创出历史新高3508暂时是在3493附近,强势的情况下这两天就会柱体创新高,下次FOMC会议还有半个月时间,目前降息的概率是89.7%的概率仍然偏大,周五有非农数据,在历史的规律里面九月的第一个周通常是下跌,而临近降息的一个周反而上涨,下旬回调一波之后10月份是表现最佳的一个月。
大饼
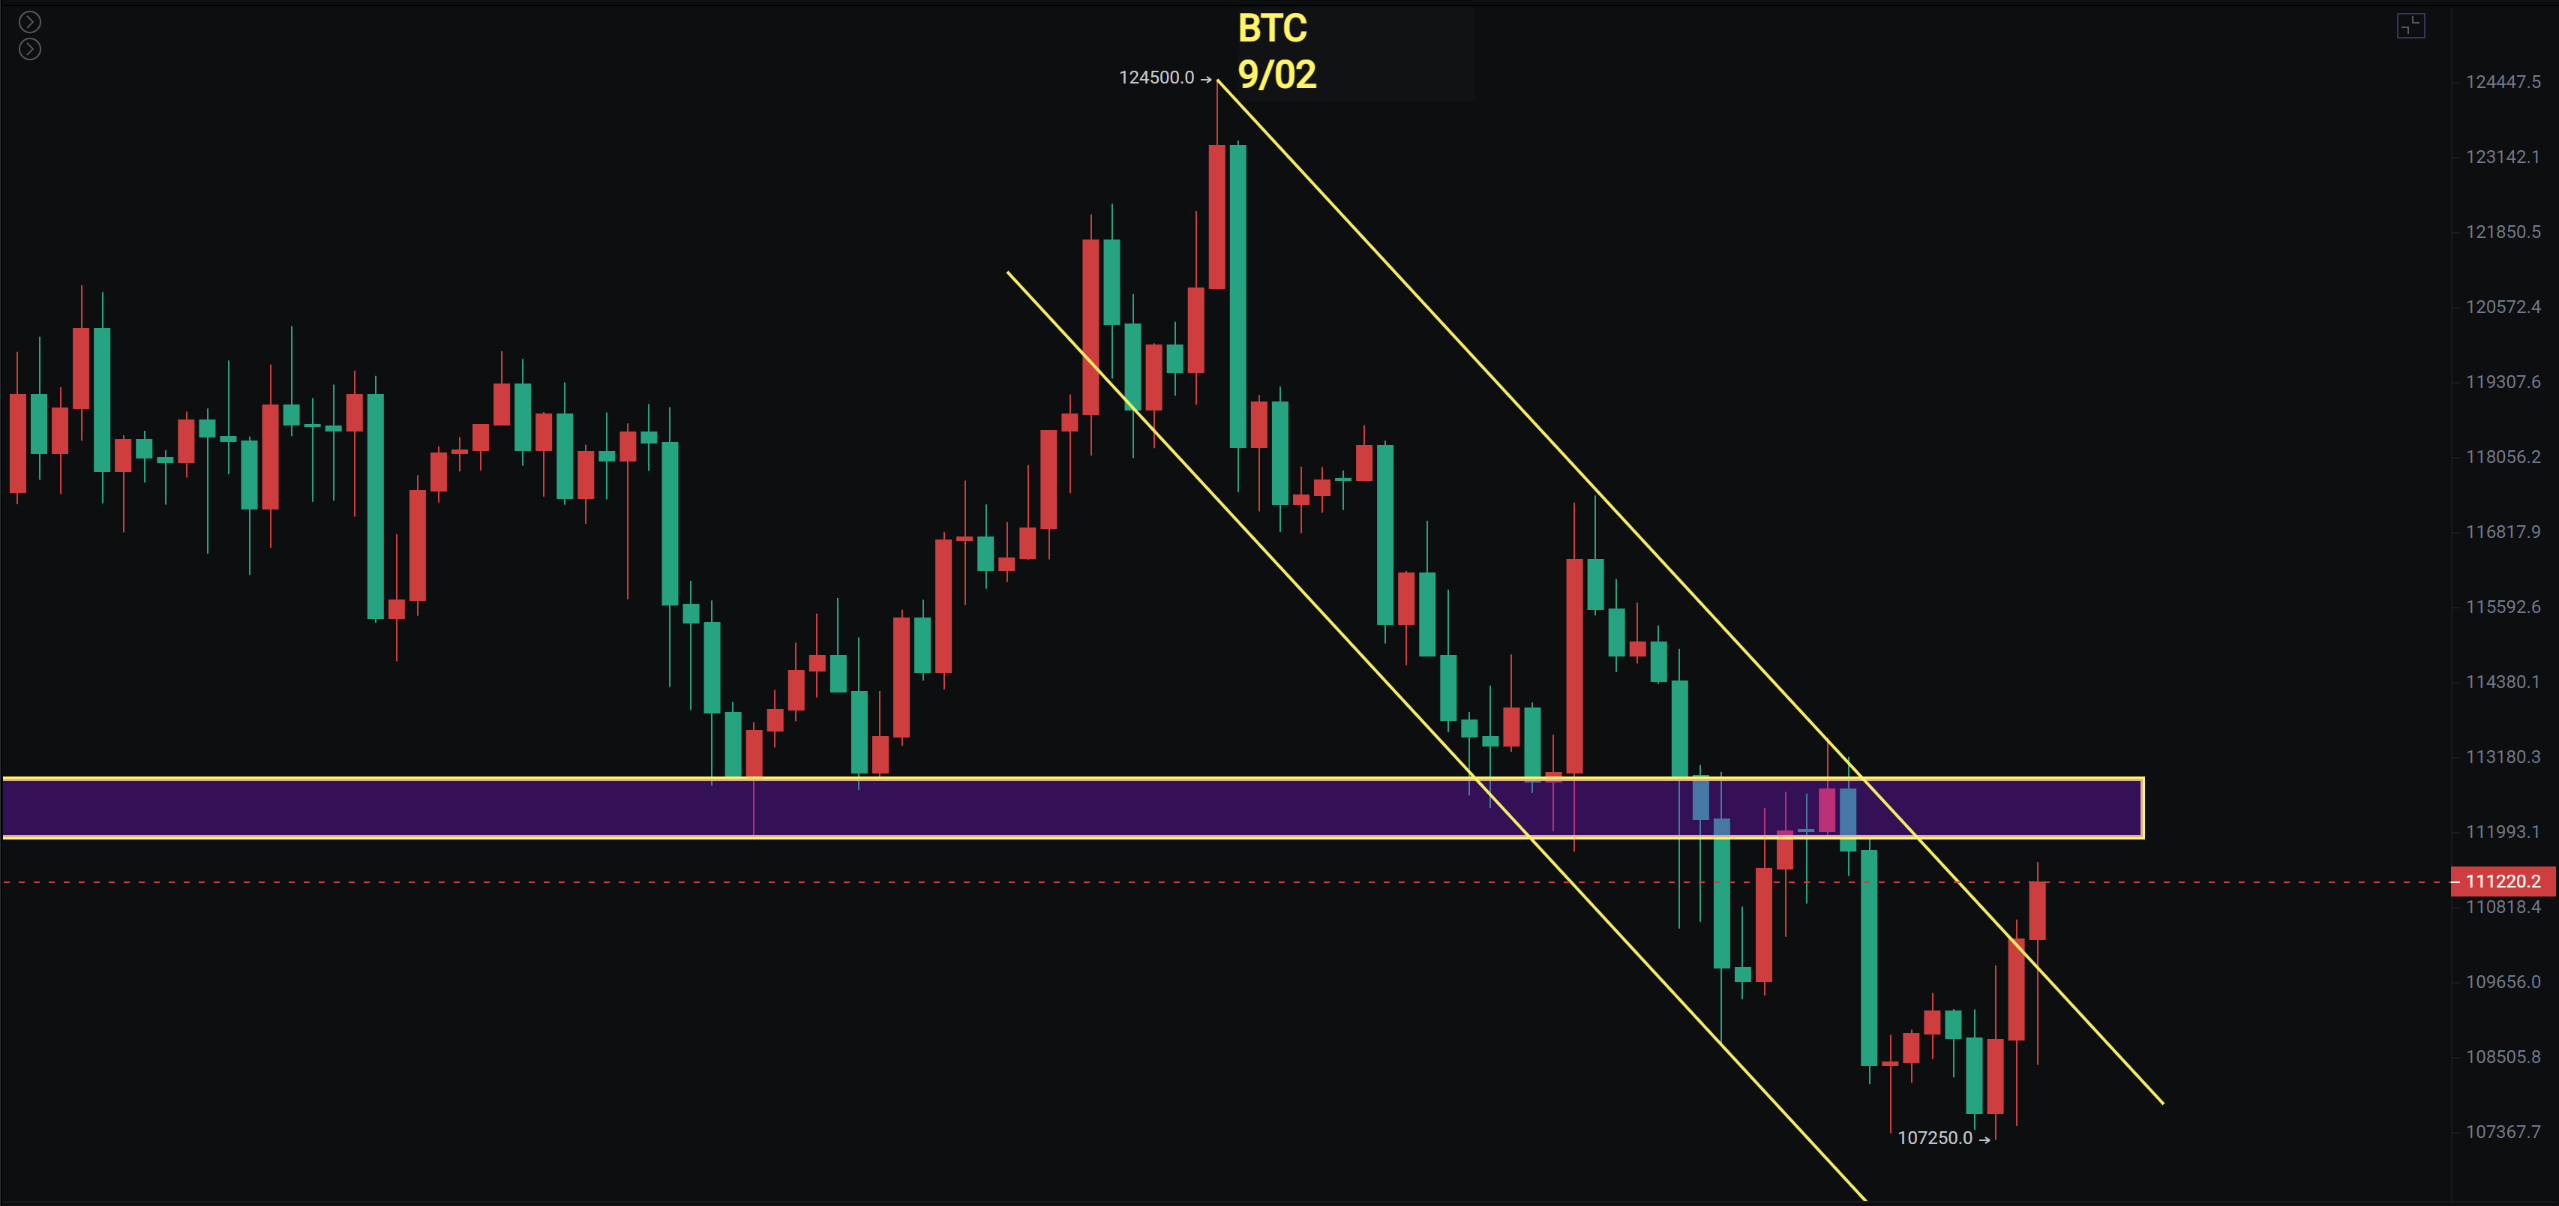
比特币短线疯狂画门,这也是一种洗盘的手法,所以我们要关注是否能重新站上M A 120,重新站上才有机会去摸113500和115000。大饼目前就是处于一个多空分水岭110000至112000的关键压力区。
日线潜在的下降楔形和4小时的下降通道,日线MACD柱体有缩短,我们关注它能否重回零轴上方和是否放量?
支撑:107000一108000
压力:112000一113500一117500
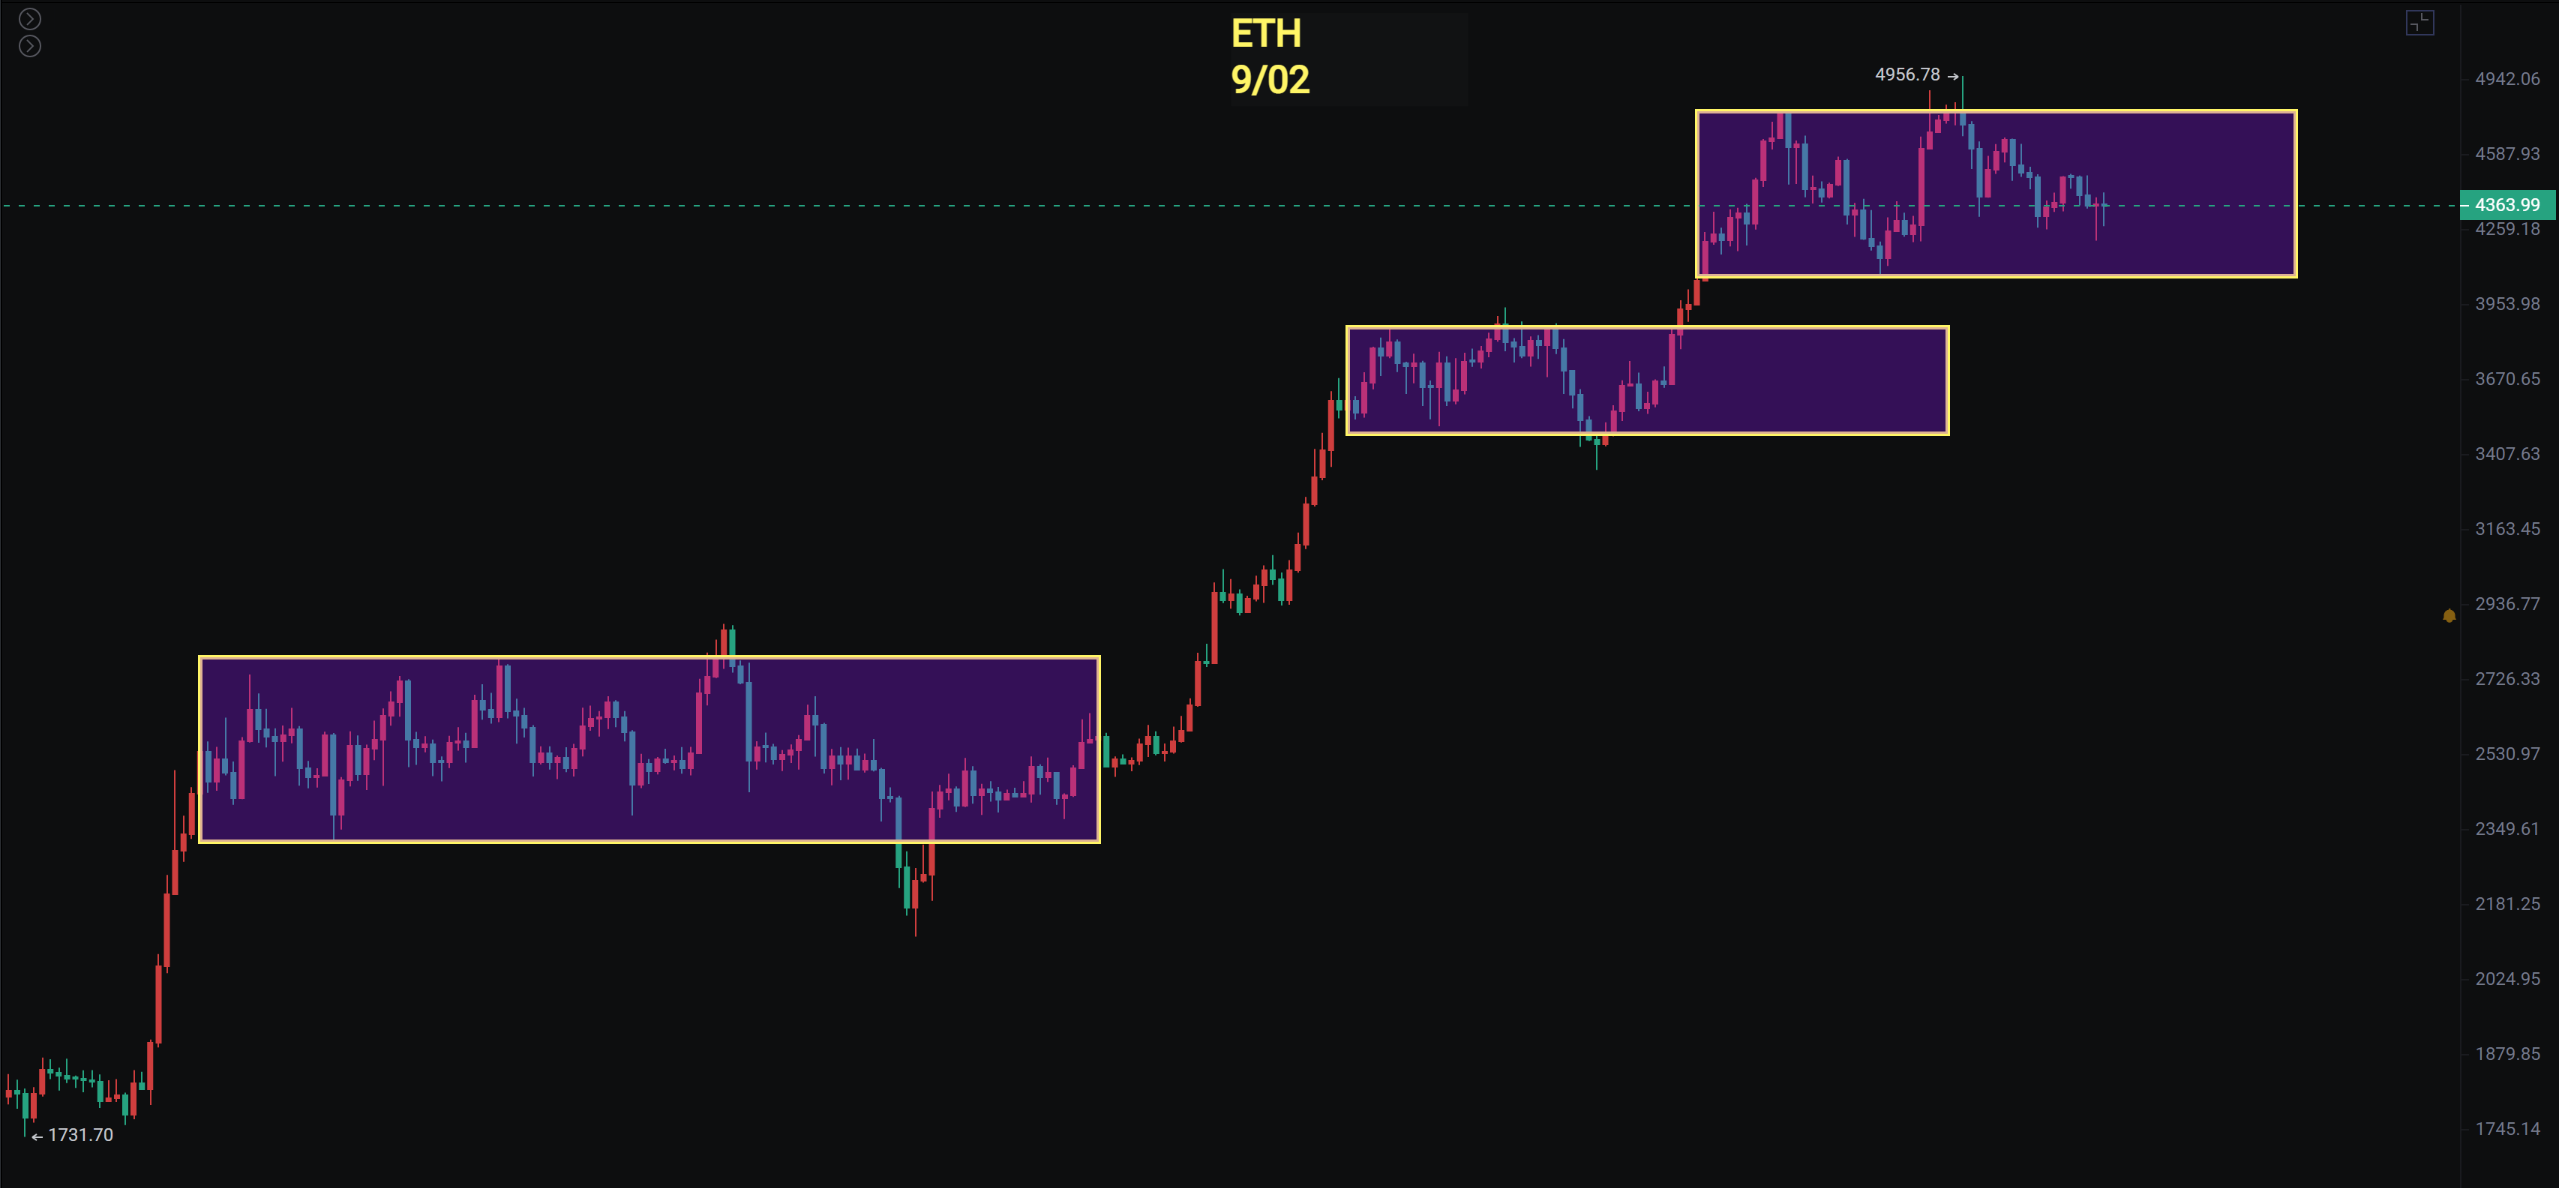
以太
以太在8月22号的大阳线底部多次的插针测试支撑,但是日线一直受MA20均线的压制,是有机会跌至M A60附近也就是3800至3900。
4小时还是视作箱体震荡,再看是否有机会假破位到3800一3900 ,以太的ETF从29号呈现流出的状态所以以太和山寨的走势需要更加留意。
支撑:3800一3900一4060
压力:4500一4665一4956
你喜欢我的观点,请点赞评论分享,我们一起穿越牛熊!!!
文章具有时效性,仅供参考实时更新
专注k线技术研究,共赢全球投资机会公众号:BTC交易公子扶苏

免责声明:本文章仅代表作者个人观点,不代表本平台的立场和观点。本文章仅供信息分享,不构成对任何人的任何投资建议。用户与作者之间的任何争议,与本平台无关。如网页中刊载的文章或图片涉及侵权,请提供相关的权利证明和身份证明发送邮件到support@aicoin.com,本平台相关工作人员将会进行核查。


