昨日种种,皆成今日你我,不是每个人都能做自己想做的事,成为自己想成为的人。我们总以为长大了,就能搞定所有问题,可后来才发现,原来长大才是所有问题的开端,人一旦对现在的生活不满意,就总会怀念过去。成长的代价,就是慢慢弄丢了原来的自己。
行情在周末两天时间里,大部分都是一个震荡的走势,然后到了今天,再一次的阴跌下来,给到了一个低点,这样的行情怎么说呢,任何时候都是不怕下跌,就怕行情不断的阴跌。行情整体的运行应该也是在我们预期之中,从前面开始,一路的看回调,最终的结果也是如此,而且我们操作上,基本上回调的利润还是吃的差不多了,本来我们认为行情在108000下方,会有一波不错的反弹出现,但结果周末的时候,反弹最高也只是给到了109000上方,便再次回调,力度属实太差了,这也导致我们前面做的108000下方多单在上移止损之后保本出局了,做了个寂寞。
回到今天的行情上,还是老规矩先看流动性的分布,从长期流动性方面看,大部分空头开仓均选择了低倍杠杆,而多头则选择更高的杠杆。 现在120000以下积累的空头流动性总量更多,但价格附近区域,多头流动性更多一些。 因此可以预期的行情是短线有可能再往下清算一波,如果迅速收回 ,那么后续就可以期待一波期货空头的清算反弹行情了。 而短期上,下方多头流动性要清算完成,则需要回调至106000-105500区域,上方短期空头则是在108900和110200附近,现货溢价方面,没有什么特别大的变动,说明市场在当前的不断阴跌局势下,也没有十分大的兴趣。
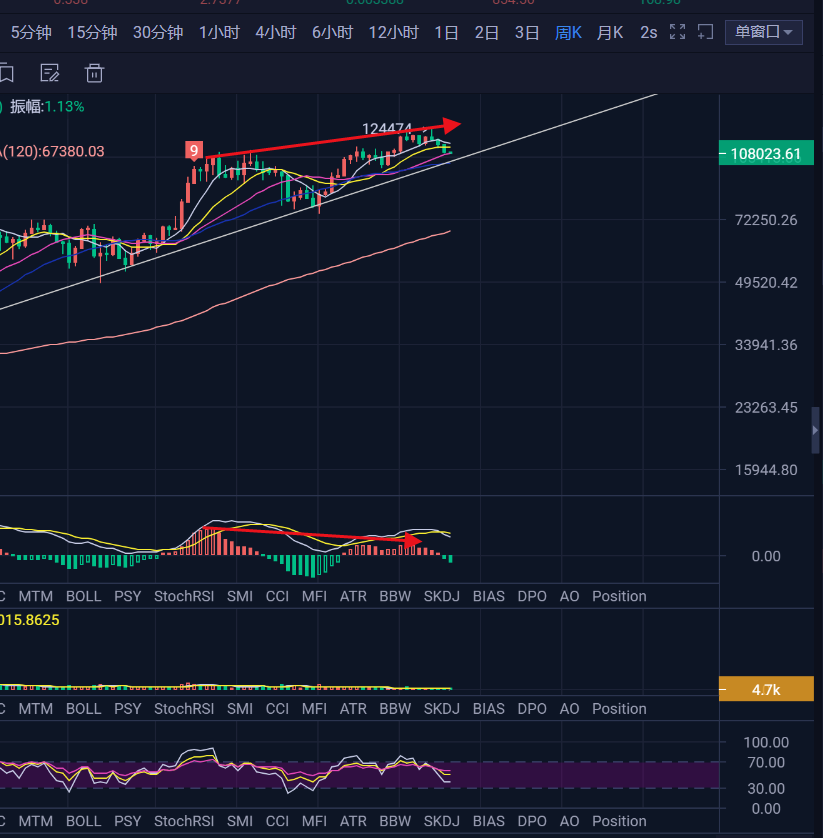
技术面上,又是新的一周了,首先还是看下周线,上周K线再次收阴,形成三连阴的空头排列,技术指标周线MACD确认死叉并形成顶背离,这是周线上在2021年出现顶背离之后,再一次出现的大周期级别背离结构,而21年的背离之后,走出了一轮大回调。按照MACD前一轮调整的低点是在74500附近,并且出现放大量下跌,如果本轮周线级别的背离走出力度来,正常的走势就是会给到一个周期性的更低点,大级别走势形成日期就比较久了,或许真能见到比较低价的比特币出现?
日线级别,还是在走延续性的空头行情,目前再一次的跌破MA120的关键趋势线,这样就使得行情 能够确认的就是一个日线周期内的弱势空头行情了,对于日线来说,就是当前在空头周期走完之后,会有一个盘面的修复,而如果日线继续向下寻找支撑,而等到之后来进行盘面修复时,所能够出现的反弹就越弱,很简单的理解就是一个恶性循环,就和前面日线在强势多头周期的时候一样,强势盘面的指标修复也是下跌力度很弱,而最终行情的结构就是一路上涨,目前往大的看,就是日线下方还有一个97000附近的趋势大支撑了,这种日线阴跌的行情,如果是做趋势操作,最合适的就是等日线先走出个弱反弹来,将盘面完成修复之后,做一个空头布局。
四小时级别,低位震荡的局面,说实话这里能不能止跌我也不能确定,按照技术指标来看,行情是在MACD进入到多头周期之中的,不过这个力度太差,这样就使得我们基本没看到什么有力度的反弹,我个人目前对于行情还是短期内还会有一个回调出现,如果是能够稍微反弹一下最好,毕竟现在是底部进入到震荡之中,能够给到109000附近就行,然后做一个空,去看下方106000,再来接多,这是我当前认为比较合理的行情走势。
操作上,上面已经说过了,如果反弹能够清算一下短期的高倍上方流动性,也就是108900附近所聚集的流动性,然后完成向下的多头流动性清算,若是直接就下去了,那就等105500-106000区域来接多了。
【以上分析及策略仅供参考,风险请自担,文章审核发布以及行情实时变化,信息滞后策略不具备及时性,具体操作以实时策略为准,欢迎各位进行联系交流行情】

免责声明:本文章仅代表作者个人观点,不代表本平台的立场和观点。本文章仅供信息分享,不构成对任何人的任何投资建议。用户与作者之间的任何争议,与本平台无关。如网页中刊载的文章或图片涉及侵权,请提供相关的权利证明和身份证明发送邮件到support@aicoin.com,本平台相关工作人员将会进行核查。


