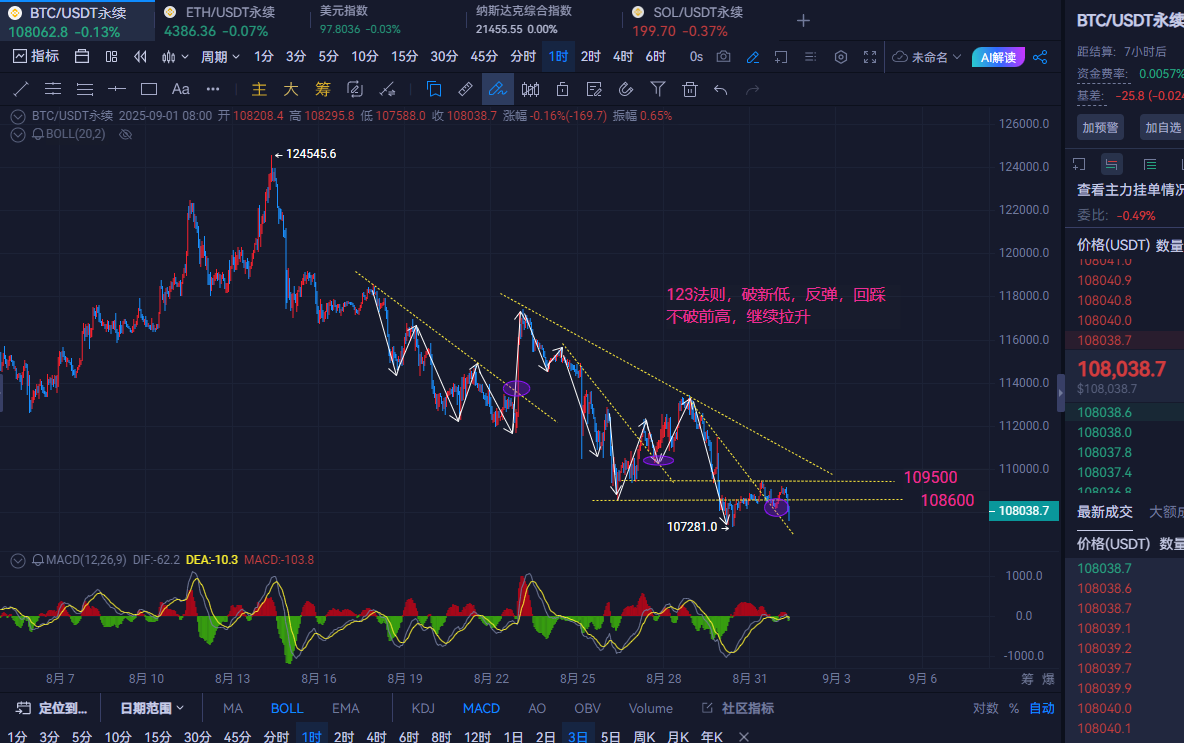
早间分析:从1小时图看,大饼价格多次上攻109500阻力未破,反而形成局部双顶,确认该区域存在沉重抛压;价格现已跌至108000附近,有概率再试探关键支撑107200-107000区域,若有效下破,下行空间或将进一步打开至106500方向。4小时图连续阴线伴随放量,表明空头动能主导。
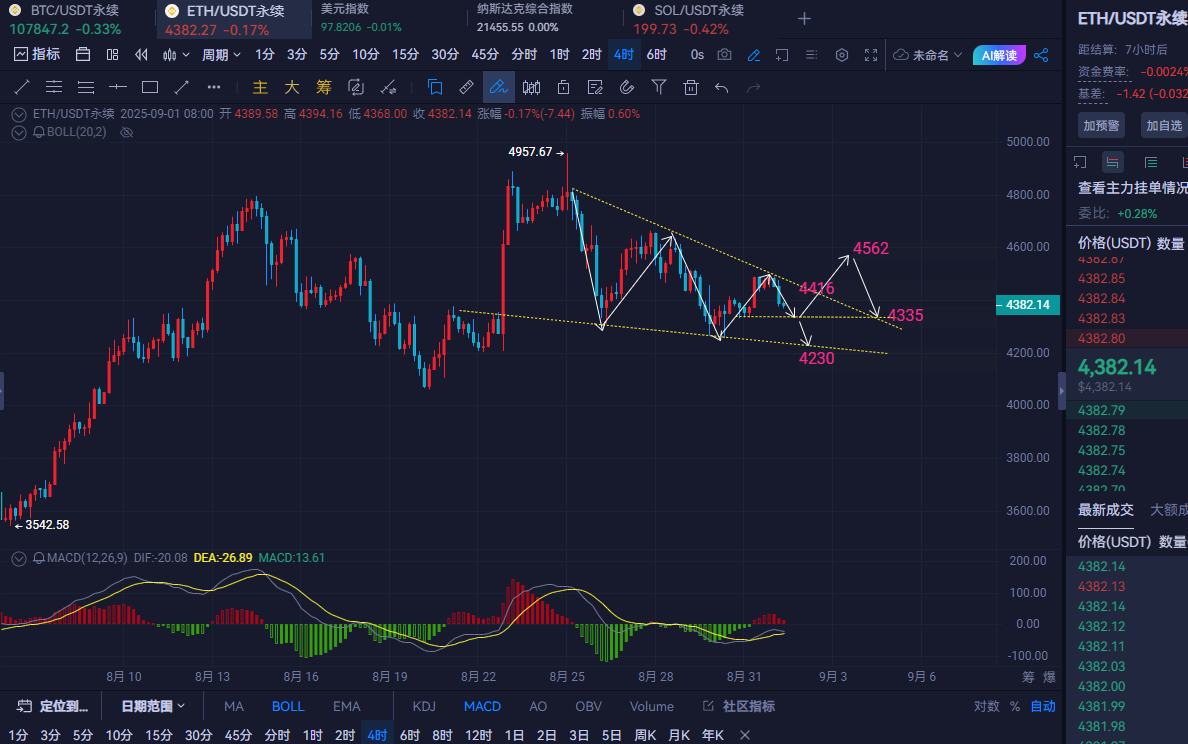
以太坊从4小时图看,出现明确的向下通道,并呈现“向下震荡三叠”形态。MACD处于0轴之下有转向死叉迹象,空头量能再次产生;整体短期格局都是偏向弱势,从时间周期来看,本轮调整也已经持续了相当一段时间,反弹都没有破关键阻力,上方压力不断下移。
操作建议:大饼反弹108500附近空,防守109200,目标看到107300-107000附近,破位看106500-106200附近,不破接多。
以太坊操作建议:反弹4435附近空,防守4480,目标看到4335-4310附近,破位看4265-4240附近,不破接多。
策略仅供参考,投资请谨慎,落袋为安。(实仓跟丹关注公众号:以太凯)
免责声明:本文章仅代表作者个人观点,不代表本平台的立场和观点。本文章仅供信息分享,不构成对任何人的任何投资建议。用户与作者之间的任何争议,与本平台无关。如网页中刊载的文章或图片涉及侵权,请提供相关的权利证明和身份证明发送邮件到support@aicoin.com,本平台相关工作人员将会进行核查。


