【价格趋势分析】
K线形态:
近期K线呈现震荡下行趋势,伴随多次长上影线,显示上方抛压较重。
8月25日出现大阴线后,价格虽有反弹,但整体未能突破前高,形成弱势反弹结构。
技术指标:
MACD:DIF和DEA均在零轴下方运行,绿柱持续放量,表明空头占据主导;但近两日绿柱缩短,有减弱迹象。
RSI:当前值42.39,处于中性偏弱区域,尚未进入超卖区间,显示市场仍有一定下行动能。
EMA:收盘价位于EMA7(112471.52)下方,且EMA7、EMA30、EMA120呈空头排列,说明短期、中期及长期趋势均偏空。
成交量:
8月25日暴跌时成交量显著放大,显示恐慌性抛售情绪浓厚。
随后几日成交量逐步萎缩,表明市场观望情绪增加,多空力量暂时平衡。
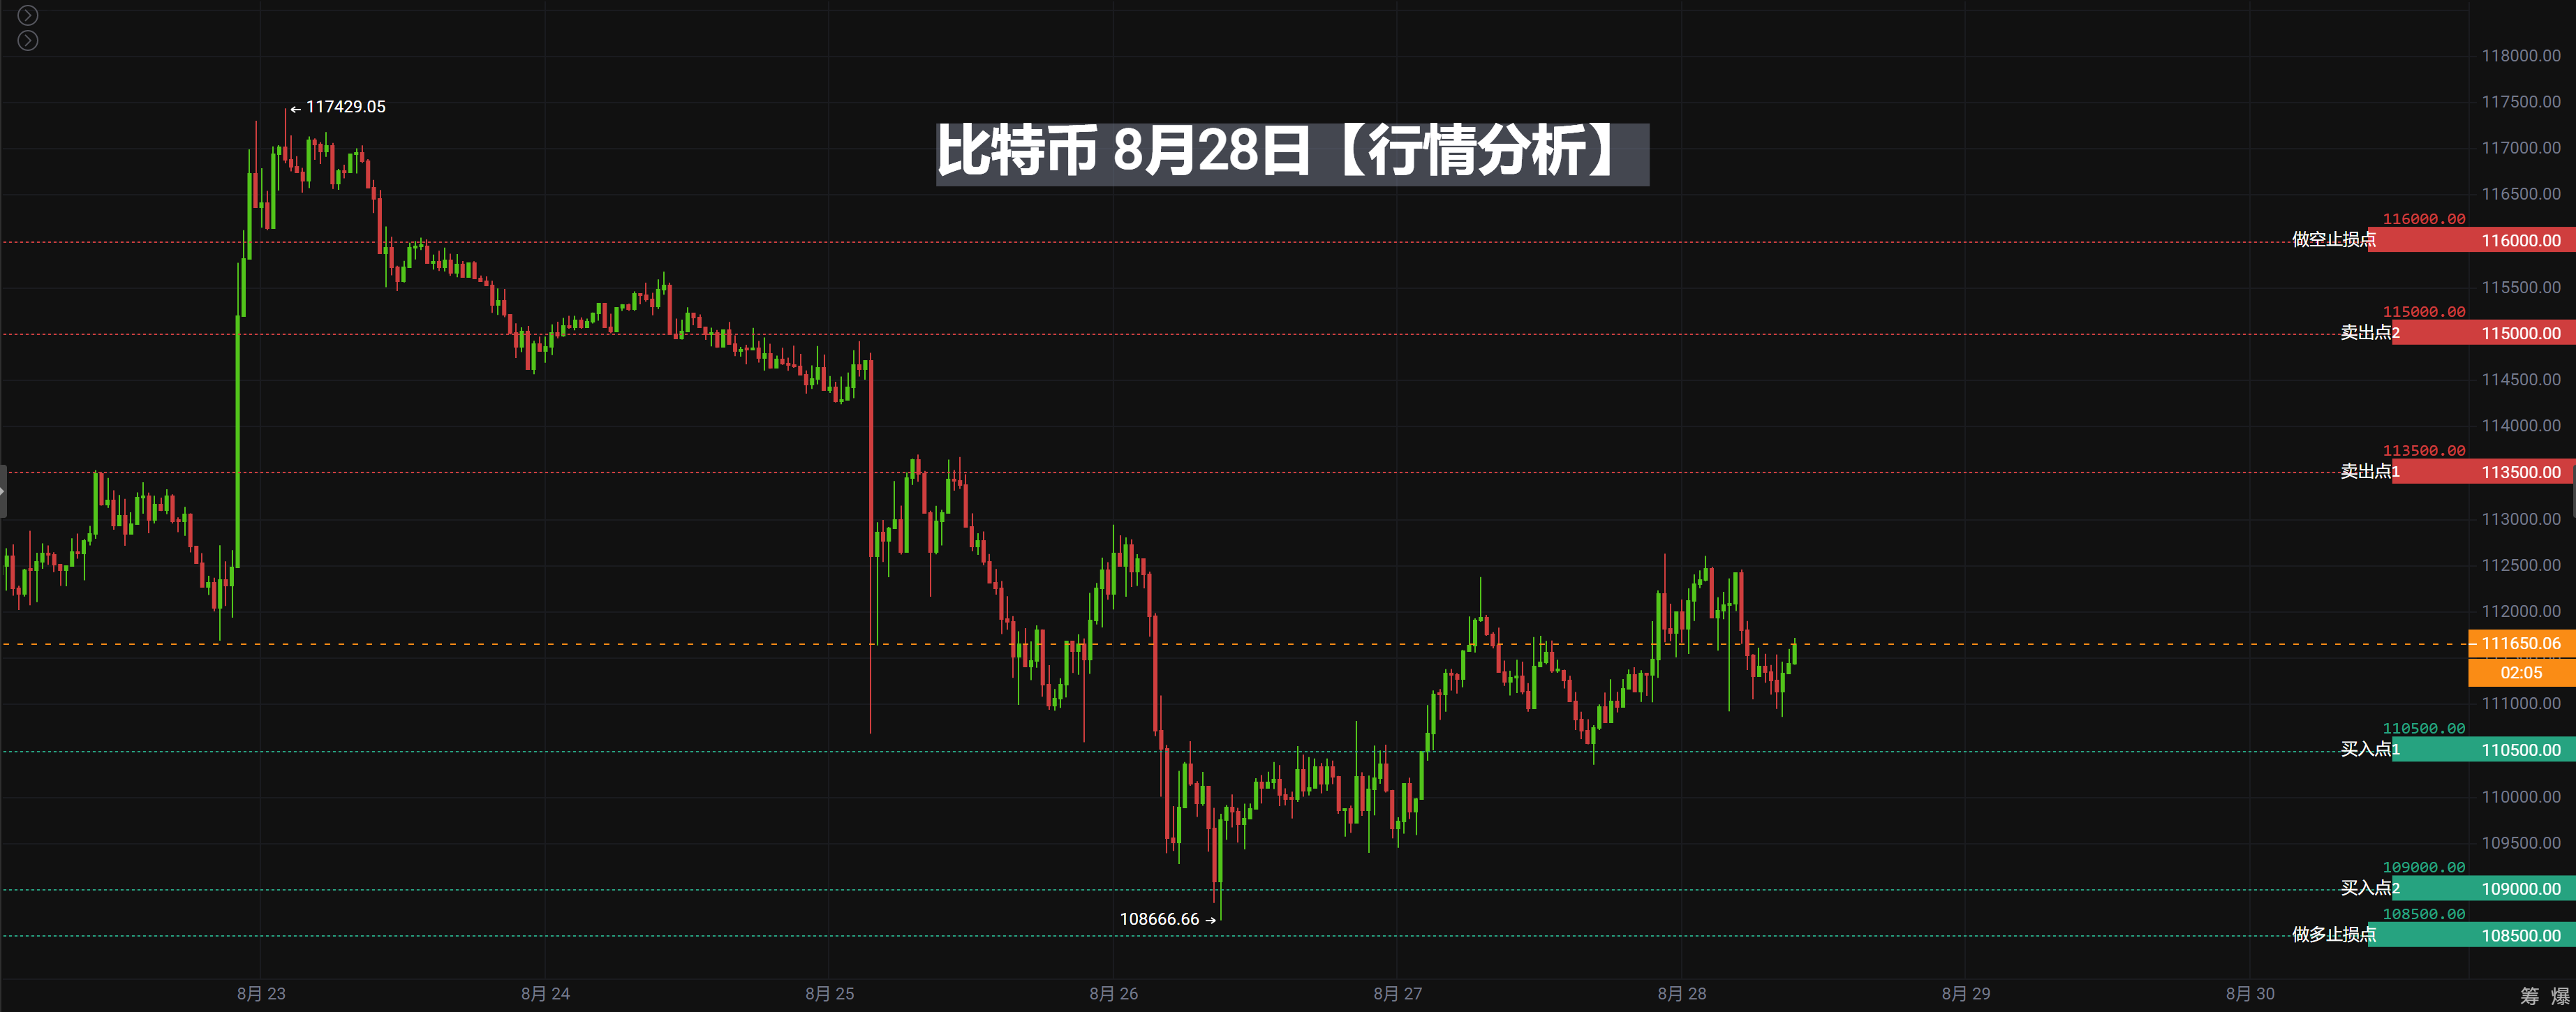
【买卖点位】
买入点一: 110500 USDT(理由:接近前低110345,整数关口支撑较强,同时EMA120在109375附近提供长期支撑。)
买入点二: 109000 USDT(理由:进一步靠近8月25日最低点109274,历史波段低点可能吸引更多买盘。)
卖出点一: 113500 USDT(理由:接近近期反弹高点113667,整数关口压力明显,同时EMA30在114841附近形成压制。)
卖出点二: 115000 USDT(理由:靠近8月24日最高点115666,整数关口及前高抛压显著。)
全天候不定时直播现场讲解实时策略
#腾讯会议:919-948-0091
【以上分析及策略仅供参考 风险请自担,文章审核发布或有滞后策略不具备及时性,具体操作以加密大神实时策略为准】
加入群聊探讨学习币圈专业知识,不做镰刀下的韭菜(可领取仓位分配攻略,教你如何在牛市中赚钱,在熊市中赚币)
——加密大神社区,一个专注于技术分析的社区。有任何操作或者趋势上有问题的朋友,都可以和我一起交流学习操作!共同交流,共同获利!记得加密大神,24小时都在,关注加密大神不迷路!

微信扫描二维码,关注我的公众号
免责声明:本文章仅代表作者个人观点,不代表本平台的立场和观点。本文章仅供信息分享,不构成对任何人的任何投资建议。用户与作者之间的任何争议,与本平台无关。如网页中刊载的文章或图片涉及侵权,请提供相关的权利证明和身份证明发送邮件到support@aicoin.com,本平台相关工作人员将会进行核查。


