
大饼最低跌至108666这里刚好也是牛熊线MA120的支撑,这里会有反弹去触碰MA20和MA60压力大致的位置在114700下方,如果后续不能重新站回两线上方则还有下跌的风险,周线也是跌近MA20支撑附近MACD下穿零轴下方快慢线交叉,所以周线这个支撑是非常关键的,后续如果跌破这里可能会走加速。
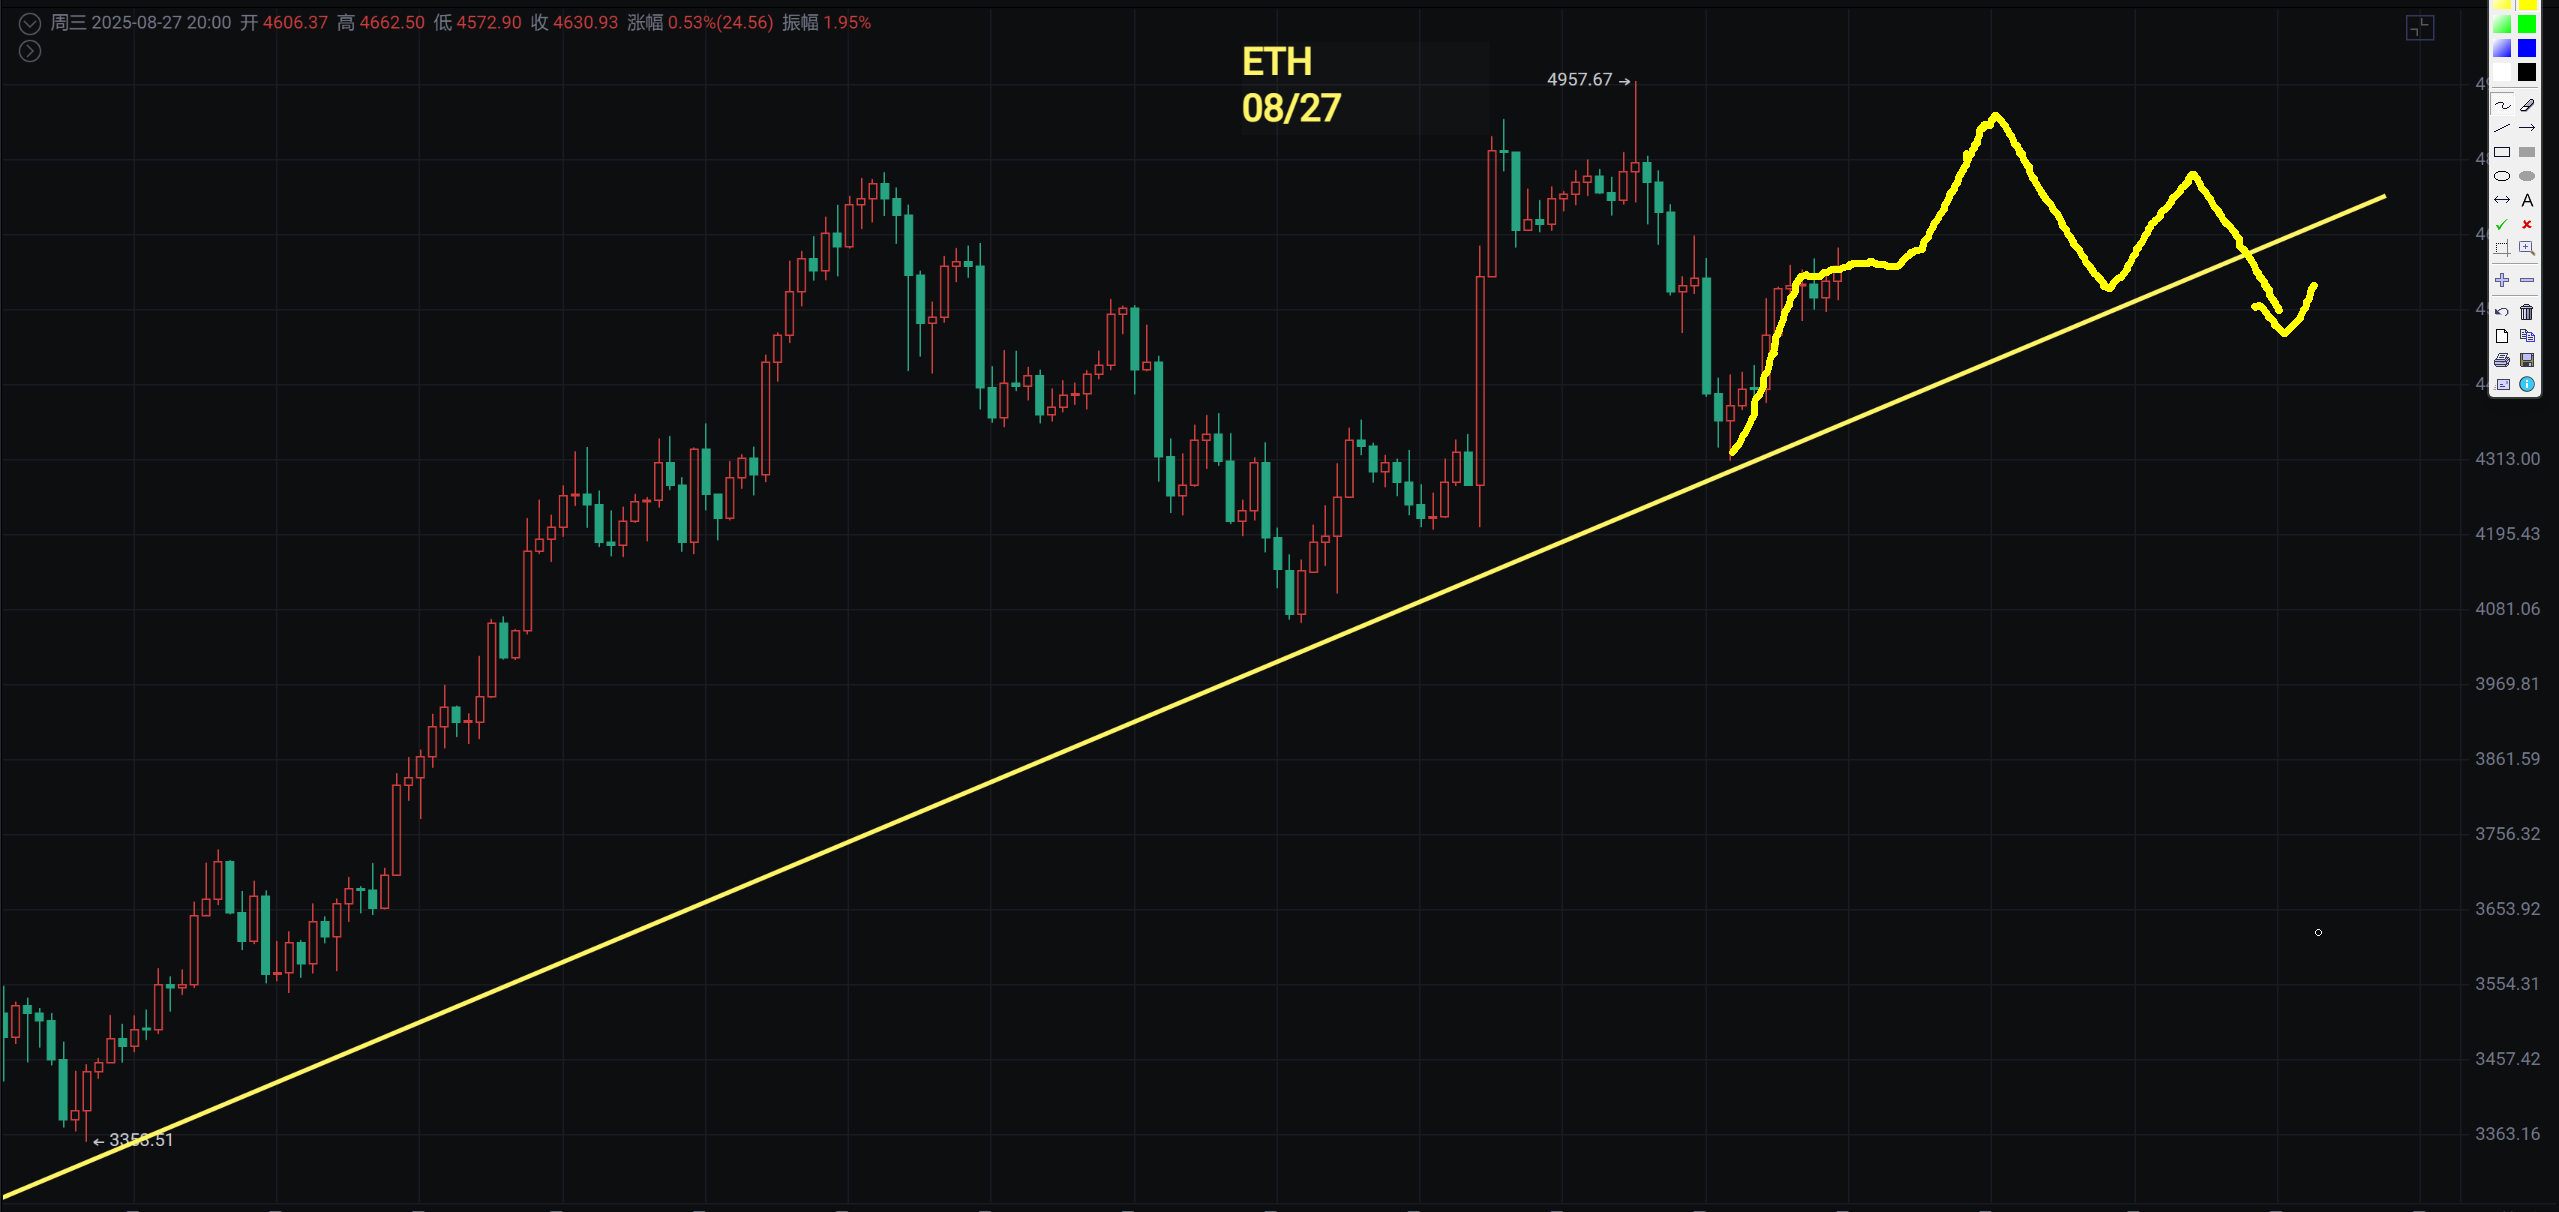
以太日线假突破,但是现在也是受MA20一线支撑,以态的回调较弱,但是公子的角度来说宁愿回调下来的低吸暂时支撑在4300和4060。
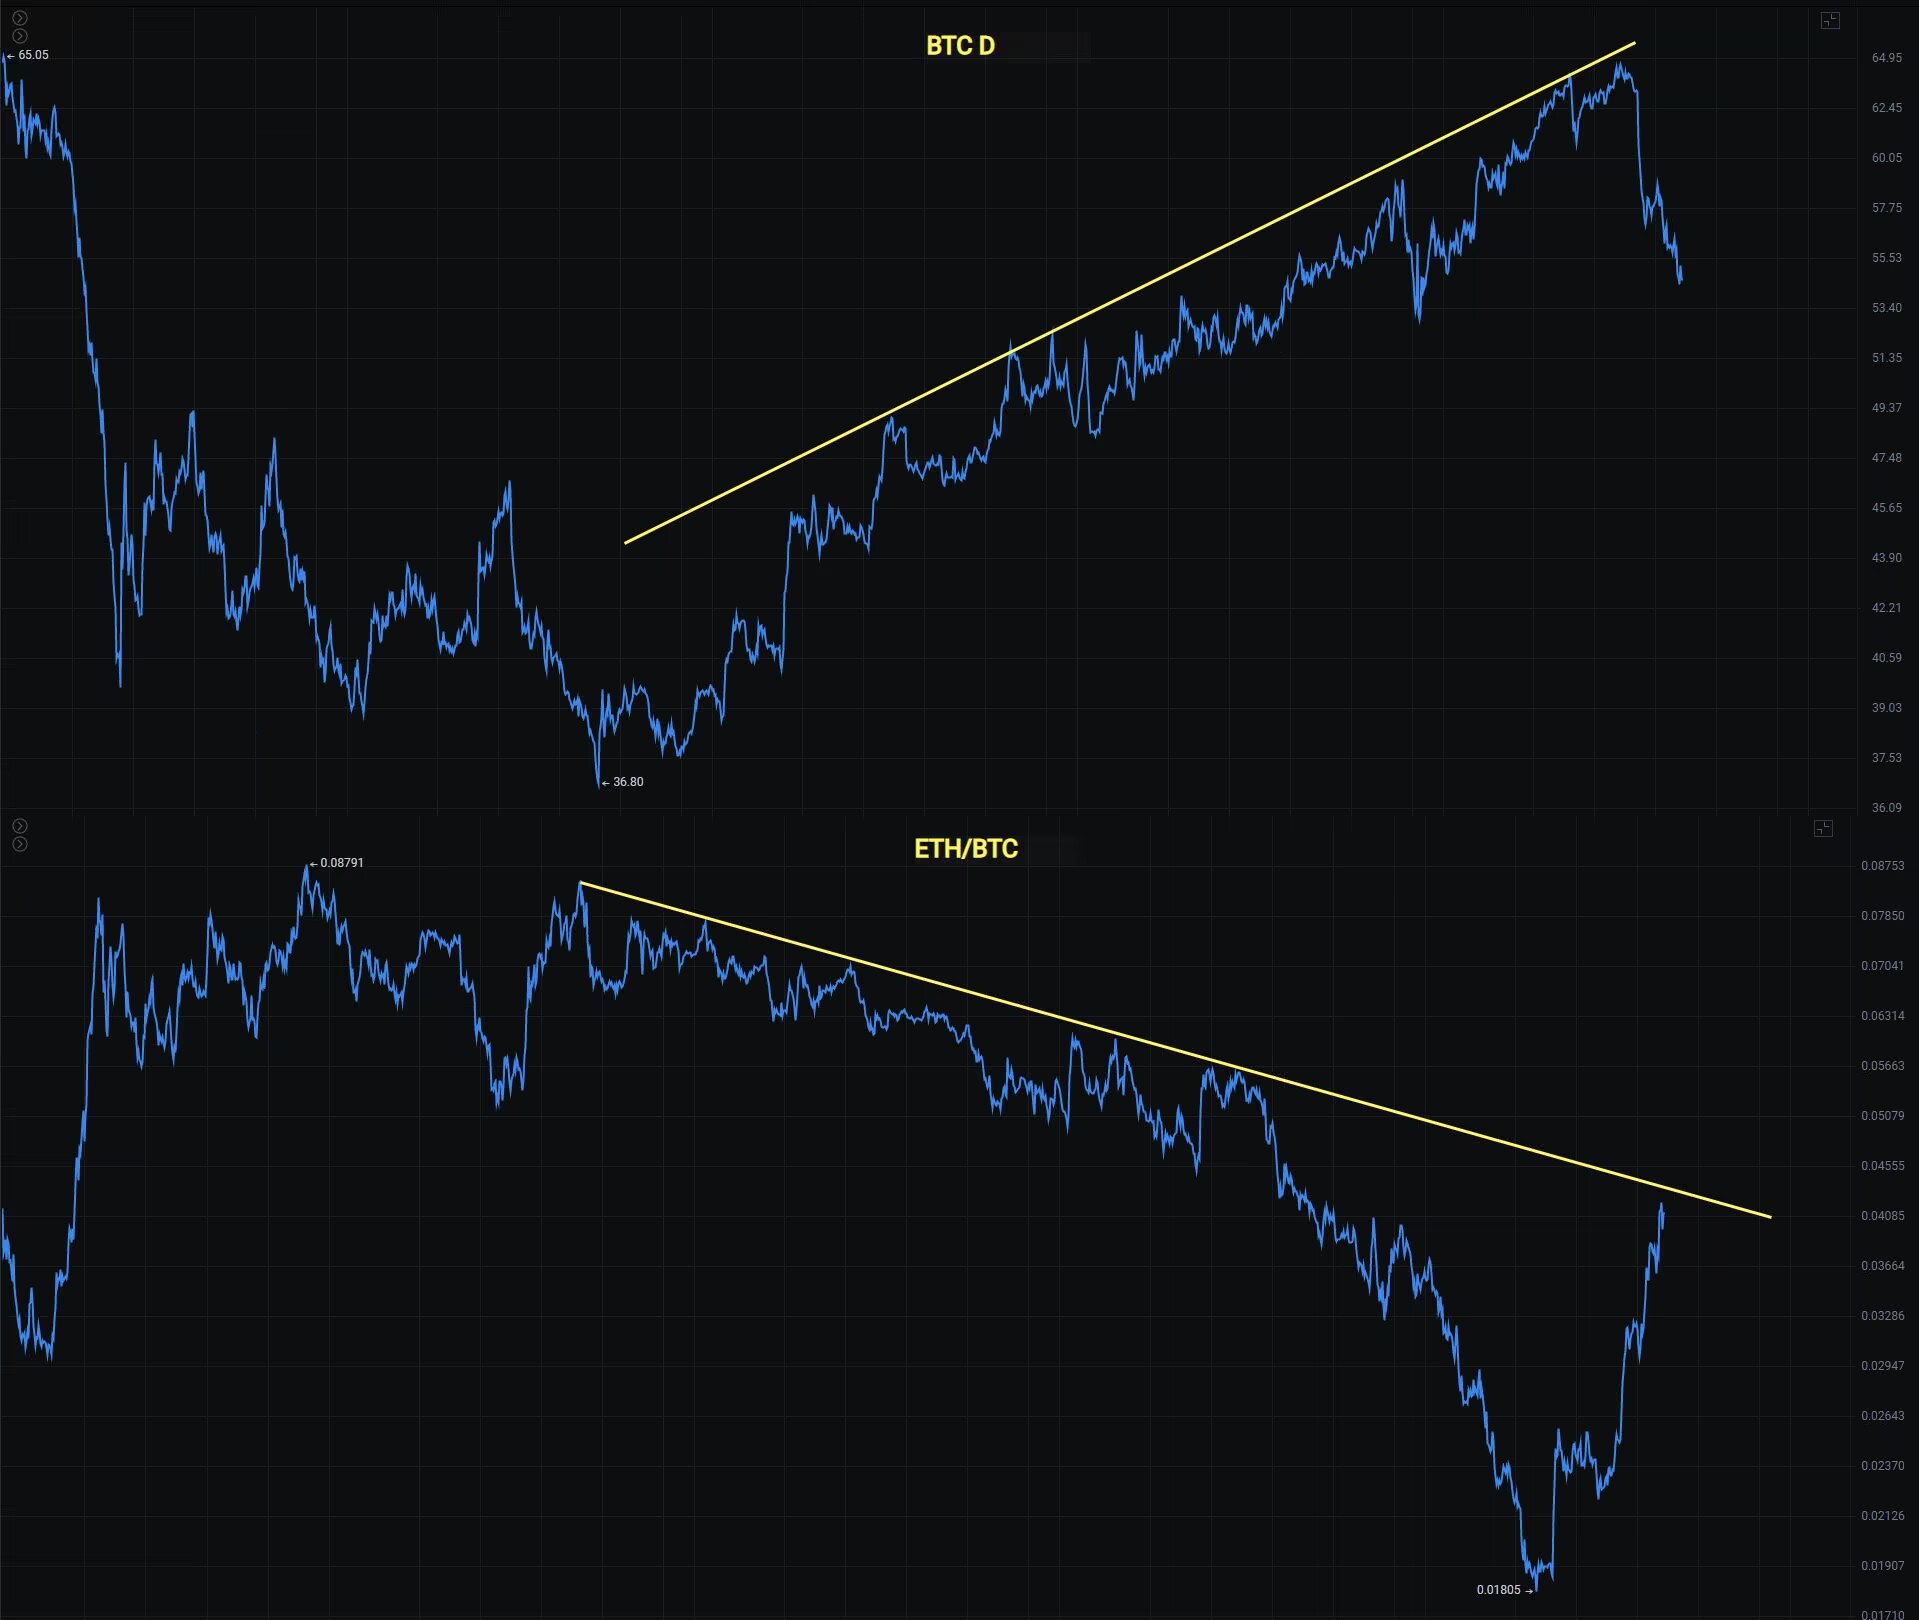
ETH/BTC汇率反弹接近周线的MA120和斐波那契0.382下方,短线来说继续反弹至0.5下方就是来到了维持几年的M头压力是会比较大的。所以以太反弹到4500一4868就认为会承压,提&醒大家不要FOMO性价比不高。
大饼
大饼回踩日线MA120这里刚好也是周线的支撑,所以这一线非常关键,周线三连跌MACD柱体下穿零轴快慢线交叉,日线跌破了箱体112000的支撑但是目前的价格又没有脱离太多。
短线看继续反弹我们关注反弹压力在114700和117400。在22号鲍威尔发言拉升的时候也提醒价格没有站上118600下跌风险无法解除,所以接下来就是重点关注MA120线的支撑。同时关注反弹力度,价格最少要收回117400甚至118600才算安全。
支撑:98000一100000一105000
压力:114700一117400一186000
以太
以太走势的变化不大,还是在日线的趋势线上方但是日线走了一个假突破,接下来以太这里不太好操作,整个回调比较弱势,但是上涨的空间也是有限,还是建议后续回调下来再分批去接,短线继续看反弹,反弹压力4720一4778,不能出新高还会回调。
支撑:4400一4520
压力:4788一4956
你喜欢我的观点,请点赞评论分享,我们一起穿越牛熊!!!
文章具有时效性,仅供参考实时更新
专注k线技术研究,共赢全球投资机会公众号:BTC交易公子扶苏

免责声明:本文章仅代表作者个人观点,不代表本平台的立场和观点。本文章仅供信息分享,不构成对任何人的任何投资建议。用户与作者之间的任何争议,与本平台无关。如网页中刊载的文章或图片涉及侵权,请提供相关的权利证明和身份证明发送邮件到support@aicoin.com,本平台相关工作人员将会进行核查。


