
Bitcoin has officially broken below the support of the 112,000 range. After Ethereum reached a new high of 4,957, there was a false breakout on the daily chart, so the logic that has been running for years remains unchanged: BTC, ETH, altcoins, and MEME coins are in a continuous cycle. At this time, discussions about whether we are in a bull or bear market have emerged, but I will not comment on that.
At the end of 2022, when Bitcoin was over 10,000 USD, I believed that there would be a bullish trend during the Spring Festival, and my view has not changed since then. The only significant correction I anticipated was during the pullback after reaching 49,000, but after breaking through 49,000, I continued to expect a bull market.
I have always felt that there is nothing new under the sun; the world is bustling for profit. After the approval of the gold ETF, a decade-long bull market began. Interestingly, many concerns raised by skeptics of the Bitcoin ETF today are essentially the same as those raised by gold ETF bears years ago. Below is a comparison between the gold ETF and the BTC spot ETF.
The first gold ETF was launched in 2004, solving issues such as storage and low trading efficiency in traditional gold investment, achieving the "democratization" of gold investment and driving gold into an eight-year bull market, with an increase of 286.90% over the eight years following its launch (compared to only 16.84% in the previous eight years). Early investors were mainly retail investors (with institutions accounting for 36%), and there were concerns about how novice investors would react in a bear market, but the transformative impact of the ETF on the gold market was significant.
Comparison between Bitcoin ETF and Gold ETF:
Similarities: Both achieve asset "democratization" by lowering investment thresholds. The Bitcoin ETF also addresses bottlenecks such as self-custody and trust in exchanges. Market concerns for both are similar (e.g., capital flow reversal in a bear market).
Differences: The initial performance of the Bitcoin ETF far exceeded that of the gold ETF—BlackRock's Bitcoin ETF (IBIT) surpassed 10 billion USD in size within seven weeks, while the gold ETF (GLD) took two years. In the first three months of 2024, the inflow of funds into the Bitcoin spot ETF far exceeded that of the gold ETF, even diverting its funds.
There are too many specific data points to list individually; I will discuss them in detail in a video when I have the opportunity.
Bitcoin
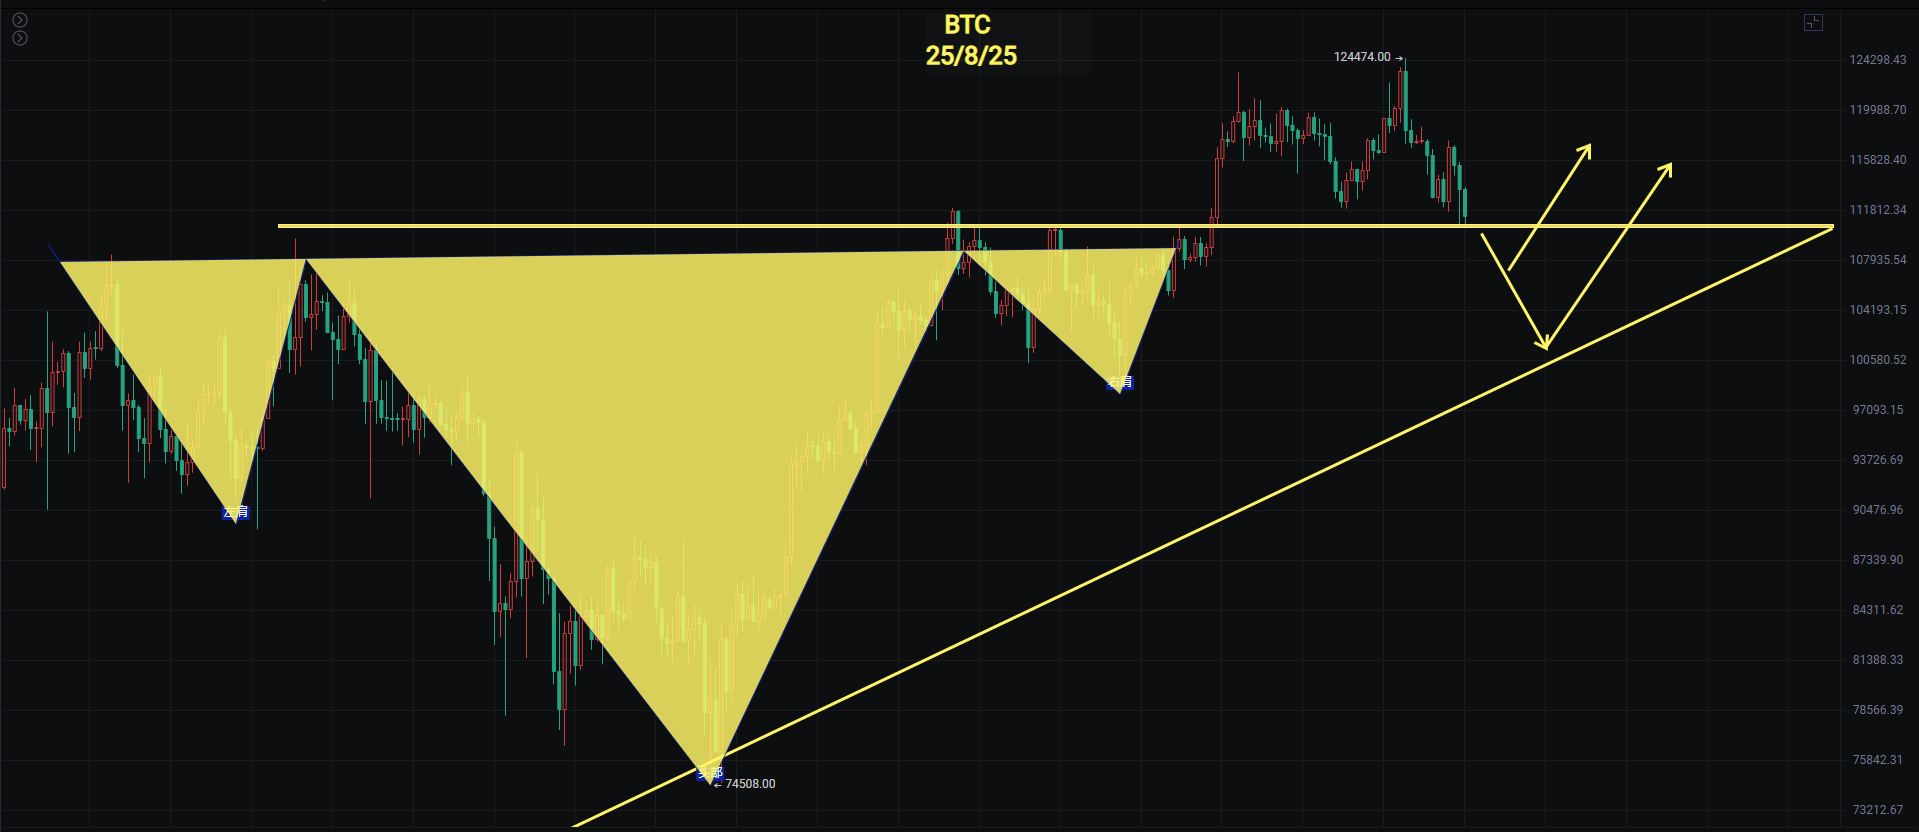
Bitcoin's daily chart continues to decline, breaking below the support of the 22nd and the daily range. Currently, the entire rebound is weak; as long as the resistance at 112,000 cannot be reclaimed, the downtrend will continue. It is currently testing the support of MA120, and if it continues to decline, the support will be between 98,000 and 100,000, which is an important psychological level for bulls.
The daily MACD histogram continues to grow below the zero line, and the OBV indicator's dual lines are turning downward. I won't specifically guess which point will show a rebound signal.
Support: 98,000 - 100,000
Resistance: 112,000 - 114,500
Ethereum
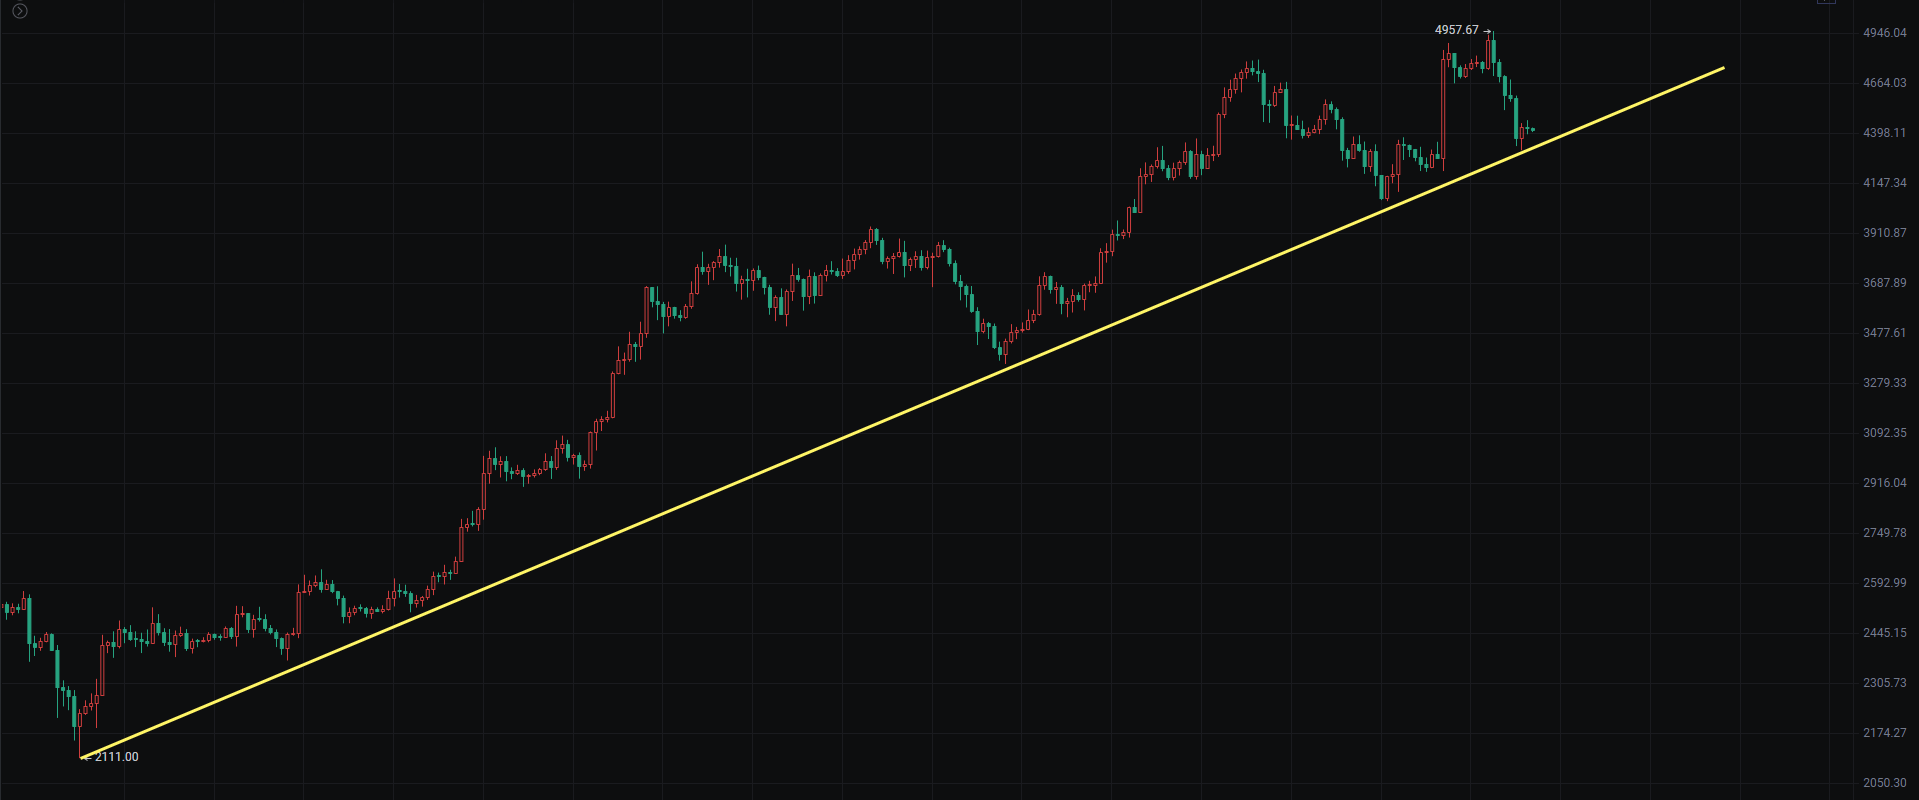
The daily chart shows a clear false breakout, and it is currently easy to form an M-top. There is also a potential shark pattern on the daily chart pointing towards around 3,500. The daily chart has shown a continuous top divergence, and this wave has increased by 2.5 times, which is the largest increase for Ethereum in recent years during a single wave. Therefore, the extent of the pullback still needs to be monitored to acquire chips at a better price-performance ratio.
On the 4-hour chart, it has retraced to the rising support line since 2,111 and is currently maintaining around 4,400. If the 4,060 M-top breaks, I believe it would be better to buy in the range of 3,300 to 3,600 for a higher price-performance ratio.
Support: 3,500 - 4,060
Resistance: 4,788 - 4,956
If you like my views, please like, comment, and share. Let's navigate through the bull and bear markets together!!!
The article is time-sensitive and for reference only; it will be updated in real-time.
Focusing on K-line technical research, sharing global investment opportunities. Public account: BTC Trading Prince Fusu

免责声明:本文章仅代表作者个人观点,不代表本平台的立场和观点。本文章仅供信息分享,不构成对任何人的任何投资建议。用户与作者之间的任何争议,与本平台无关。如网页中刊载的文章或图片涉及侵权,请提供相关的权利证明和身份证明发送邮件到support@aicoin.com,本平台相关工作人员将会进行核查。


