【价格趋势分析】
K线形态:
最近几日K线呈现震荡下行趋势,8月25日收盘价低于开盘价,形成阴线,且连续两日出现较长的上影线,表明上方抛压较重。
8月22日暴涨后价格未能延续强势,随后多日回调,显示市场短期内处于修正阶段。
技术指标:
MACD:DIF和DEA均在零轴下方运行,MACD柱状图持续为负值并扩大,显示空头力量占优,但当前DIF逐渐靠近DEA,有可能酝酿金叉反弹。
RSI:RSI14数值42.41,接近超卖区间,说明市场情绪偏弱,但尚未进入极端区域。
EMA:EMA7(114370.57)与EMA30(115729.02)均高于最新价,且EMA7向下穿越EMA30,形成死叉,进一步确认短期趋势偏空;EMA120(109303.78)仍远低于当前价格,长期趋势依然保持上升。
成交量:
近期成交量有所放大,尤其是8月22日暴涨时伴随明显放量,显示资金活跃度提升。
随后的几日成交量逐步减少,表明市场观望情绪加重,动能减弱。
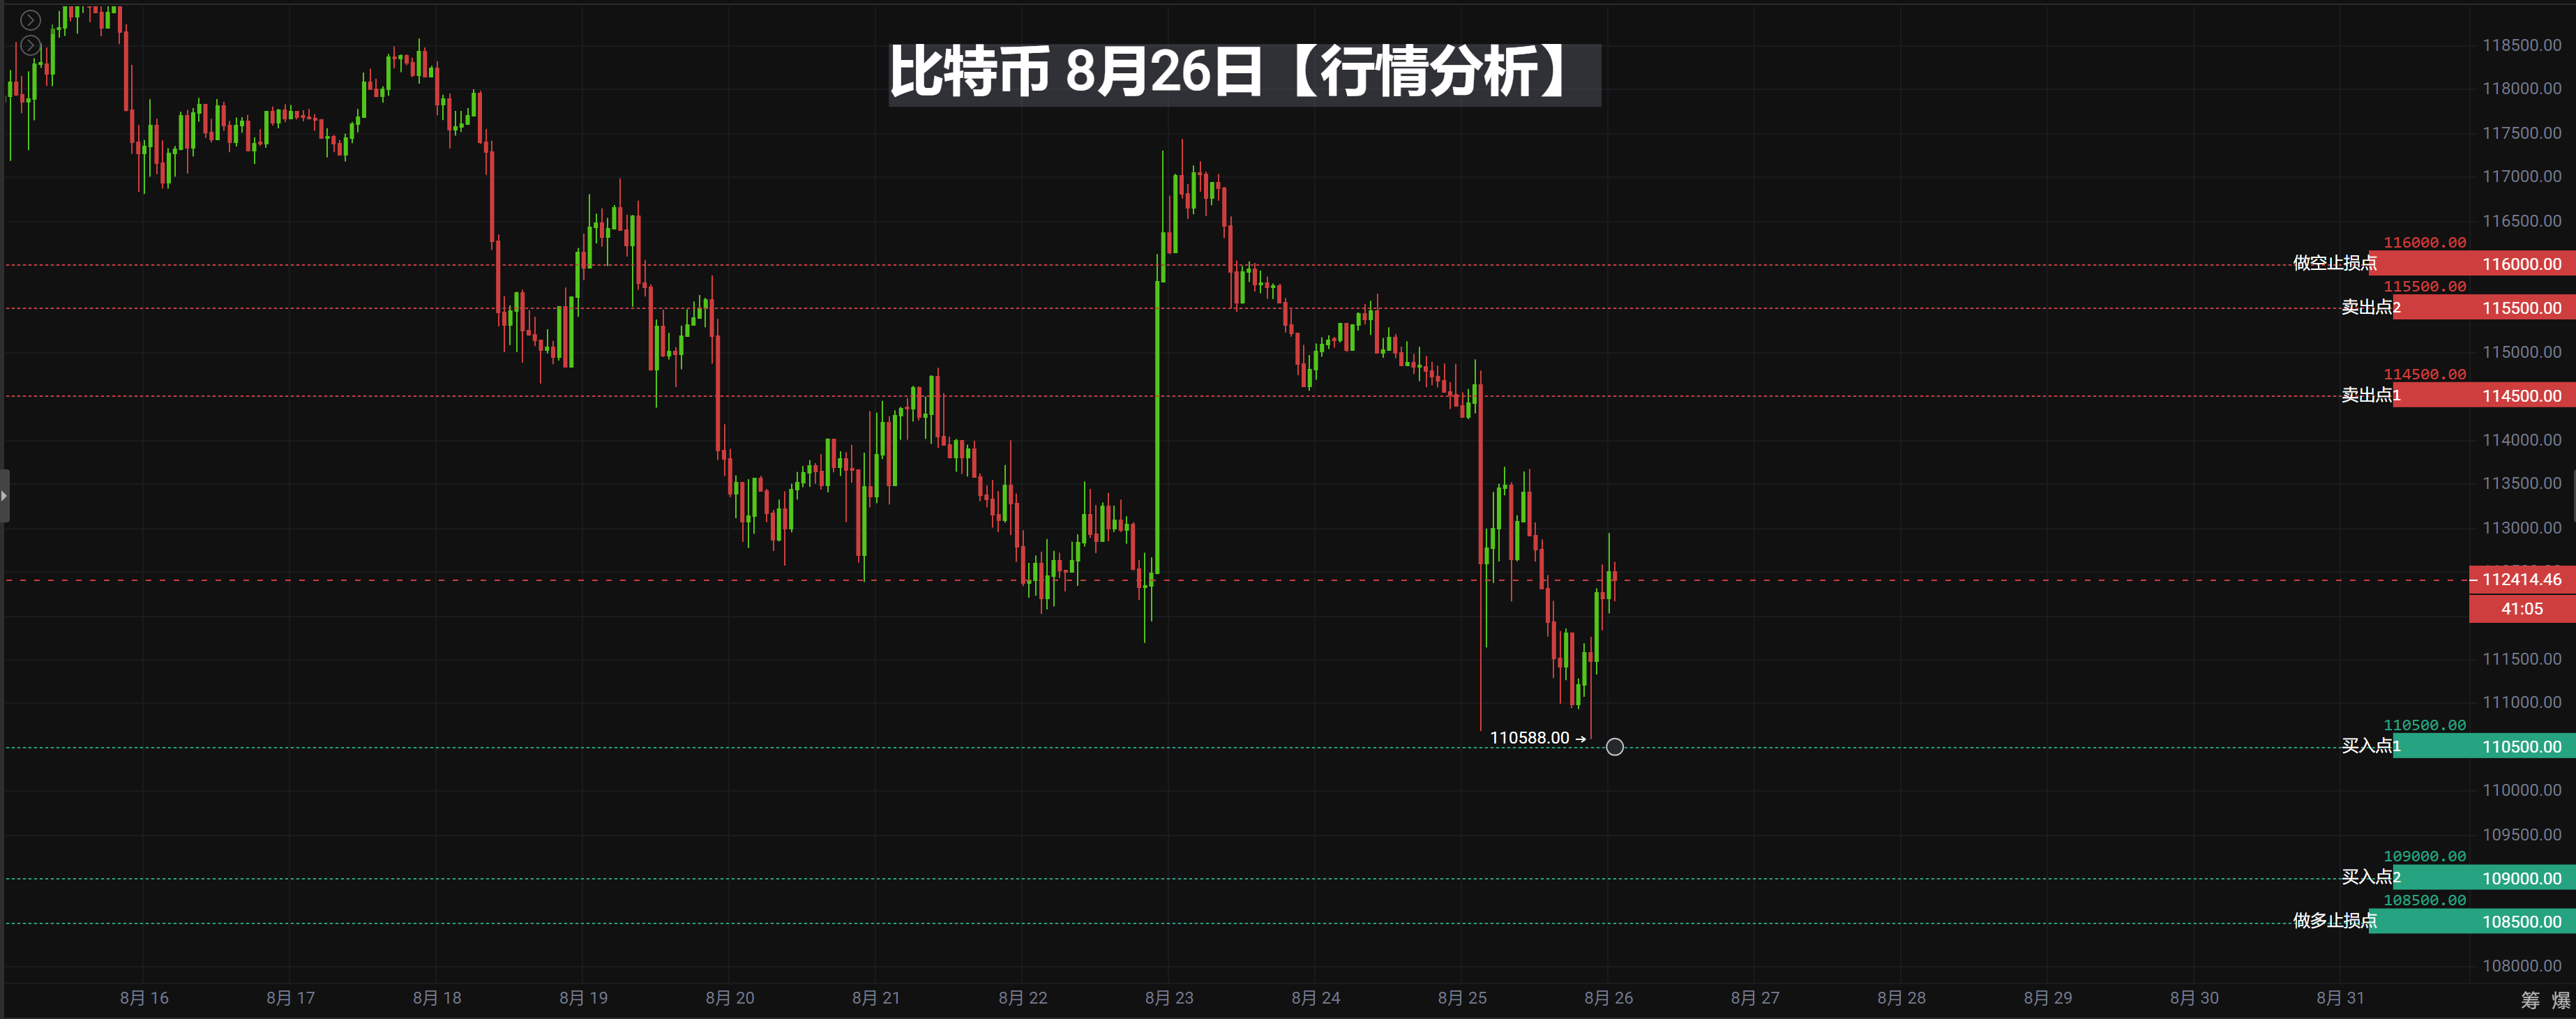
【买卖点位】
买入点一: 110500 USDT(理由:接近前低点110588,整数关口具有支撑作用,同时靠近EMA120均线109303.78附近,长期趋势仍为上升)
买入点二: 109000 USDT(理由:进一步下探至更强支撑区域,接近EMA120均线位置,并且符合1%以上的间隔要求)
做多止损点: 108500 USDT(理由:若价格跌破EMA120及整数关口 108500,则可能出现进一步下行风险,因此设置止损位)
卖出点一: 114500 USDT(理由:接近EMA7均线114370.57和前波段高点113667.28,存在抛压压力)
卖出点二: 115500 USDT(理由:进一步上探至EMA30均线115729.02附近,同时符合1%以上的间隔要求)
做空止损点: 116000 USDT(理由:若价格突破EMA30并站稳整数关口 116000,则短期趋势可能转向反弹,因此设置止损位)#BTC#ETH
全天候不定时直播现场讲解实时策略
#腾讯会议:919-948-0091
【以上分析及策略仅供参考 风险请自担,文章审核发布或有滞后策略不具备及时性,具体操作以加密大神实时策略为准】
加入群聊探讨学习币圈专业知识,不做镰刀下的韭菜(可领取仓位分配攻略,教你如何在牛市中赚钱,在熊市中赚币)
——加密大神社区,一个专注于技术分析的社区。有任何操作或者趋势上有问题的朋友,都可以和我一起交流学习操作!共同交流,共同获利!记得加密大神,24小时都在,关注加密大神不迷路!

微信扫描二维码,关注我的公众号
免责声明:本文章仅代表作者个人观点,不代表本平台的立场和观点。本文章仅供信息分享,不构成对任何人的任何投资建议。用户与作者之间的任何争议,与本平台无关。如网页中刊载的文章或图片涉及侵权,请提供相关的权利证明和身份证明发送邮件到support@aicoin.com,本平台相关工作人员将会进行核查。


