All-day live broadcast explaining real-time strategies
#Tencent Meeting: 919-948-0091
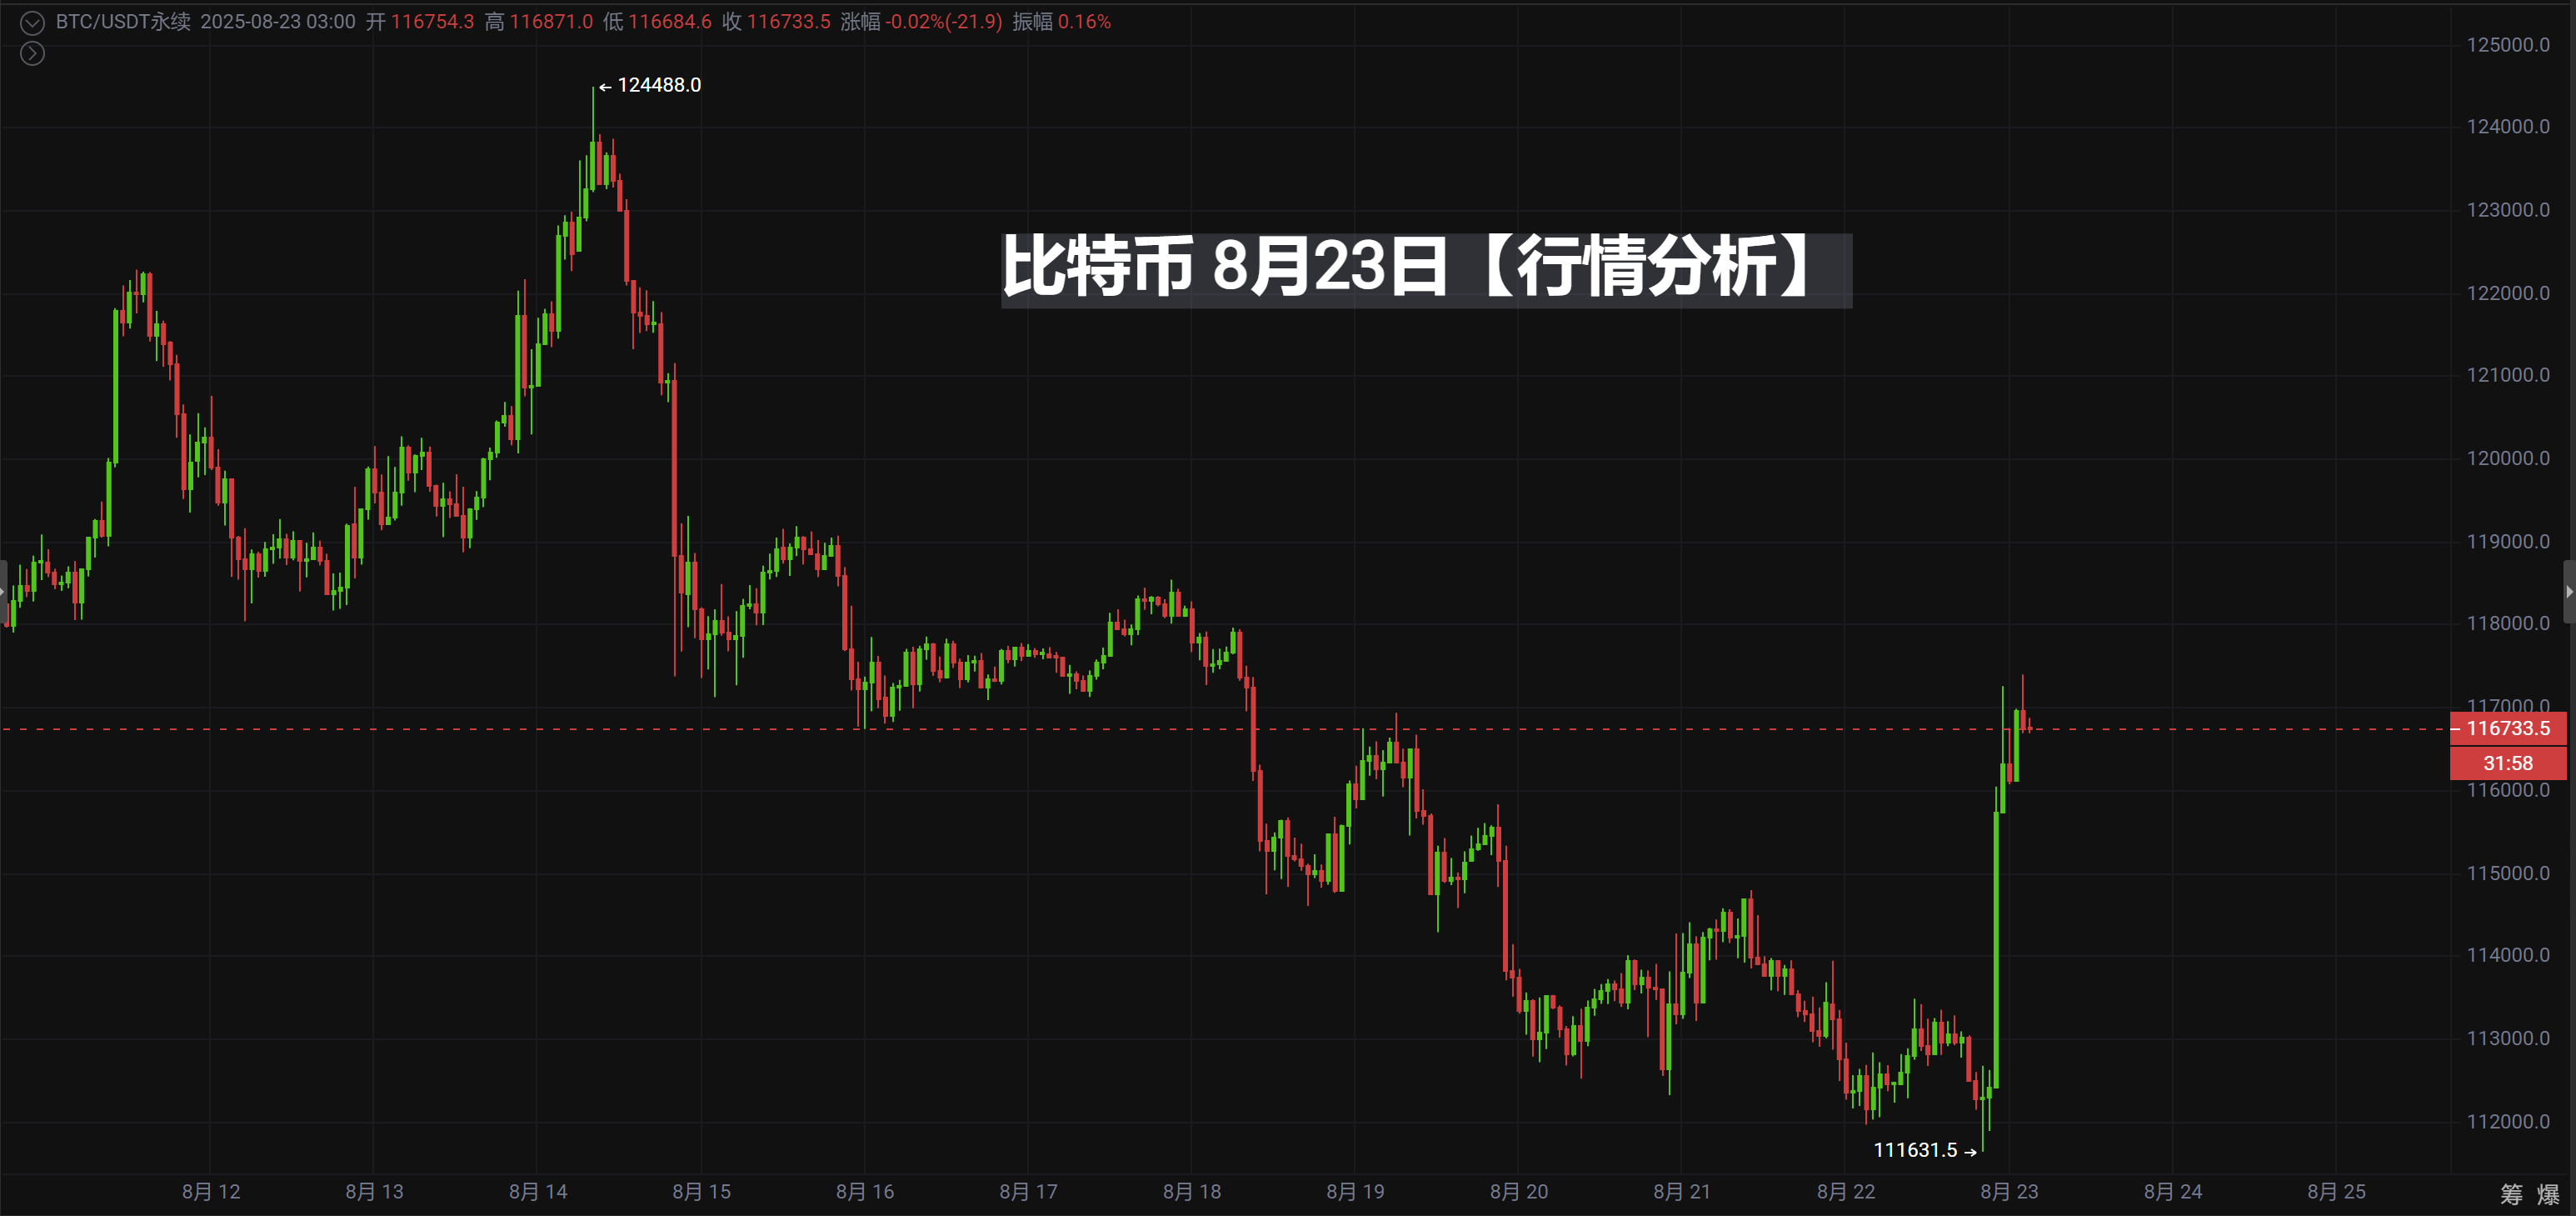
Bitcoin August 23 [Market Analysis]
🔹 K-line Pattern
Bitcoin experienced a pullback after reaching a high of around 117400, facing resistance and failing to effectively break through the key pressure above.
The daily line closed with a small bullish candle with a long upper shadow, indicating heavy selling pressure above and a weakening of short-term bullish momentum.
The price continues to operate within the 116000–118000 range, maintaining a fluctuating pattern.
🔹 Technical Indicators
MACD: The dual lines are converging below the zero axis, with the momentum bars shortening, indicating a lack of clear direction in the short term.
RSI: RSI14 is around 50, maintaining a neutral zone, not entering overbought or oversold territory.
EMA Moving Averages: EMA7 and EMA30 are nearly overlapping, with the price fluctuating around the moving averages, while EMA120 (around 107000) remains upward, indicating a long-term bullish trend.
🔹 Trading Volume
Overall, the market maintains a state of reduced volume, with cautious trading sentiment.
The pullback after yesterday's high was accompanied by a slight increase in volume, indicating that selling pressure remains strong above.
🎯 Trading Suggestions (Price Reference)
Buy Point One: 115500 USDT (short-term support level, can attempt to buy low if it doesn't break on a pullback)
Buy Point Two: 114000 USDT (strong support area, near the long lower shadow low)
Stop Loss: 113500 USDT (if it breaks below, it opens up further downside potential)
Sell Point One: 117500 USDT (upper edge of the fluctuating range, repeatedly tested resistance)
Sell Point Two: 118500 USDT (key pressure area, if it cannot break through, bears may counterattack at any time)
Stop Loss: 119000 USDT (if it breaks and holds above, it may target 120000)
📌 Summary:
Bitcoin is still in a fluctuating range in the short term, with key support in the 115500–114000 area and pressure in the 117500–118500 area.
Until there is a significant breakout with volume, it is still recommended to adopt a high short and low long strategy, patiently waiting for a directional choice.
BTC#ETH
[The above analysis and strategies are for reference only. Please bear the risks yourself. The article review and publication may have delays, and the strategies may not be timely. Specific operations should follow the real-time strategies of crypto experts.]
Join the group chat to discuss and learn professional knowledge in the crypto space, so as not to be the chives under the sickle (you can receive a position allocation guide, teaching you how to make money in a bull market and earn coins in a bear market).
——Crypto Expert Community, a community focused on technical analysis. Anyone with questions about operations or trends can communicate and learn operations with me! Let's exchange ideas and profit together! Remember, the crypto expert is available 24/7, follow the crypto expert to avoid getting lost!

Scan the QR code on WeChat to follow my public account
免责声明:本文章仅代表作者个人观点,不代表本平台的立场和观点。本文章仅供信息分享,不构成对任何人的任何投资建议。用户与作者之间的任何争议,与本平台无关。如网页中刊载的文章或图片涉及侵权,请提供相关的权利证明和身份证明发送邮件到support@aicoin.com,本平台相关工作人员将会进行核查。


