
U.S. stock indices continue to decline, with the Nasdaq dropping 1.63% at the market open today, the S&P 500 down 0.89%, and the Dow Jones index has been oscillating near previous highs without breaking through. It can currently be seen that it has also dropped back. The Nasdaq and S&P 500 have lost the gains of the previous week in just two days. Before the clear interest rate cut in September, it is not ruled out that there will be support near the low point of August 1 for further oscillation.
The U.S. dollar index has been fluctuating between 98 and 99, indicating that it is waiting for the entire interest rate cut to be finalized. London gold has been oscillating at high levels for four months. Whether there will be an interest rate cut in September is crucial. The CME gap for Bitcoin at 114271 has been filled and has temporarily tested support near 119000. If it breaks further down, the next gap is around 108000. In the short term, Bitcoin has dropped to a low of 112300 with a spike and has seen a short-term rebound.
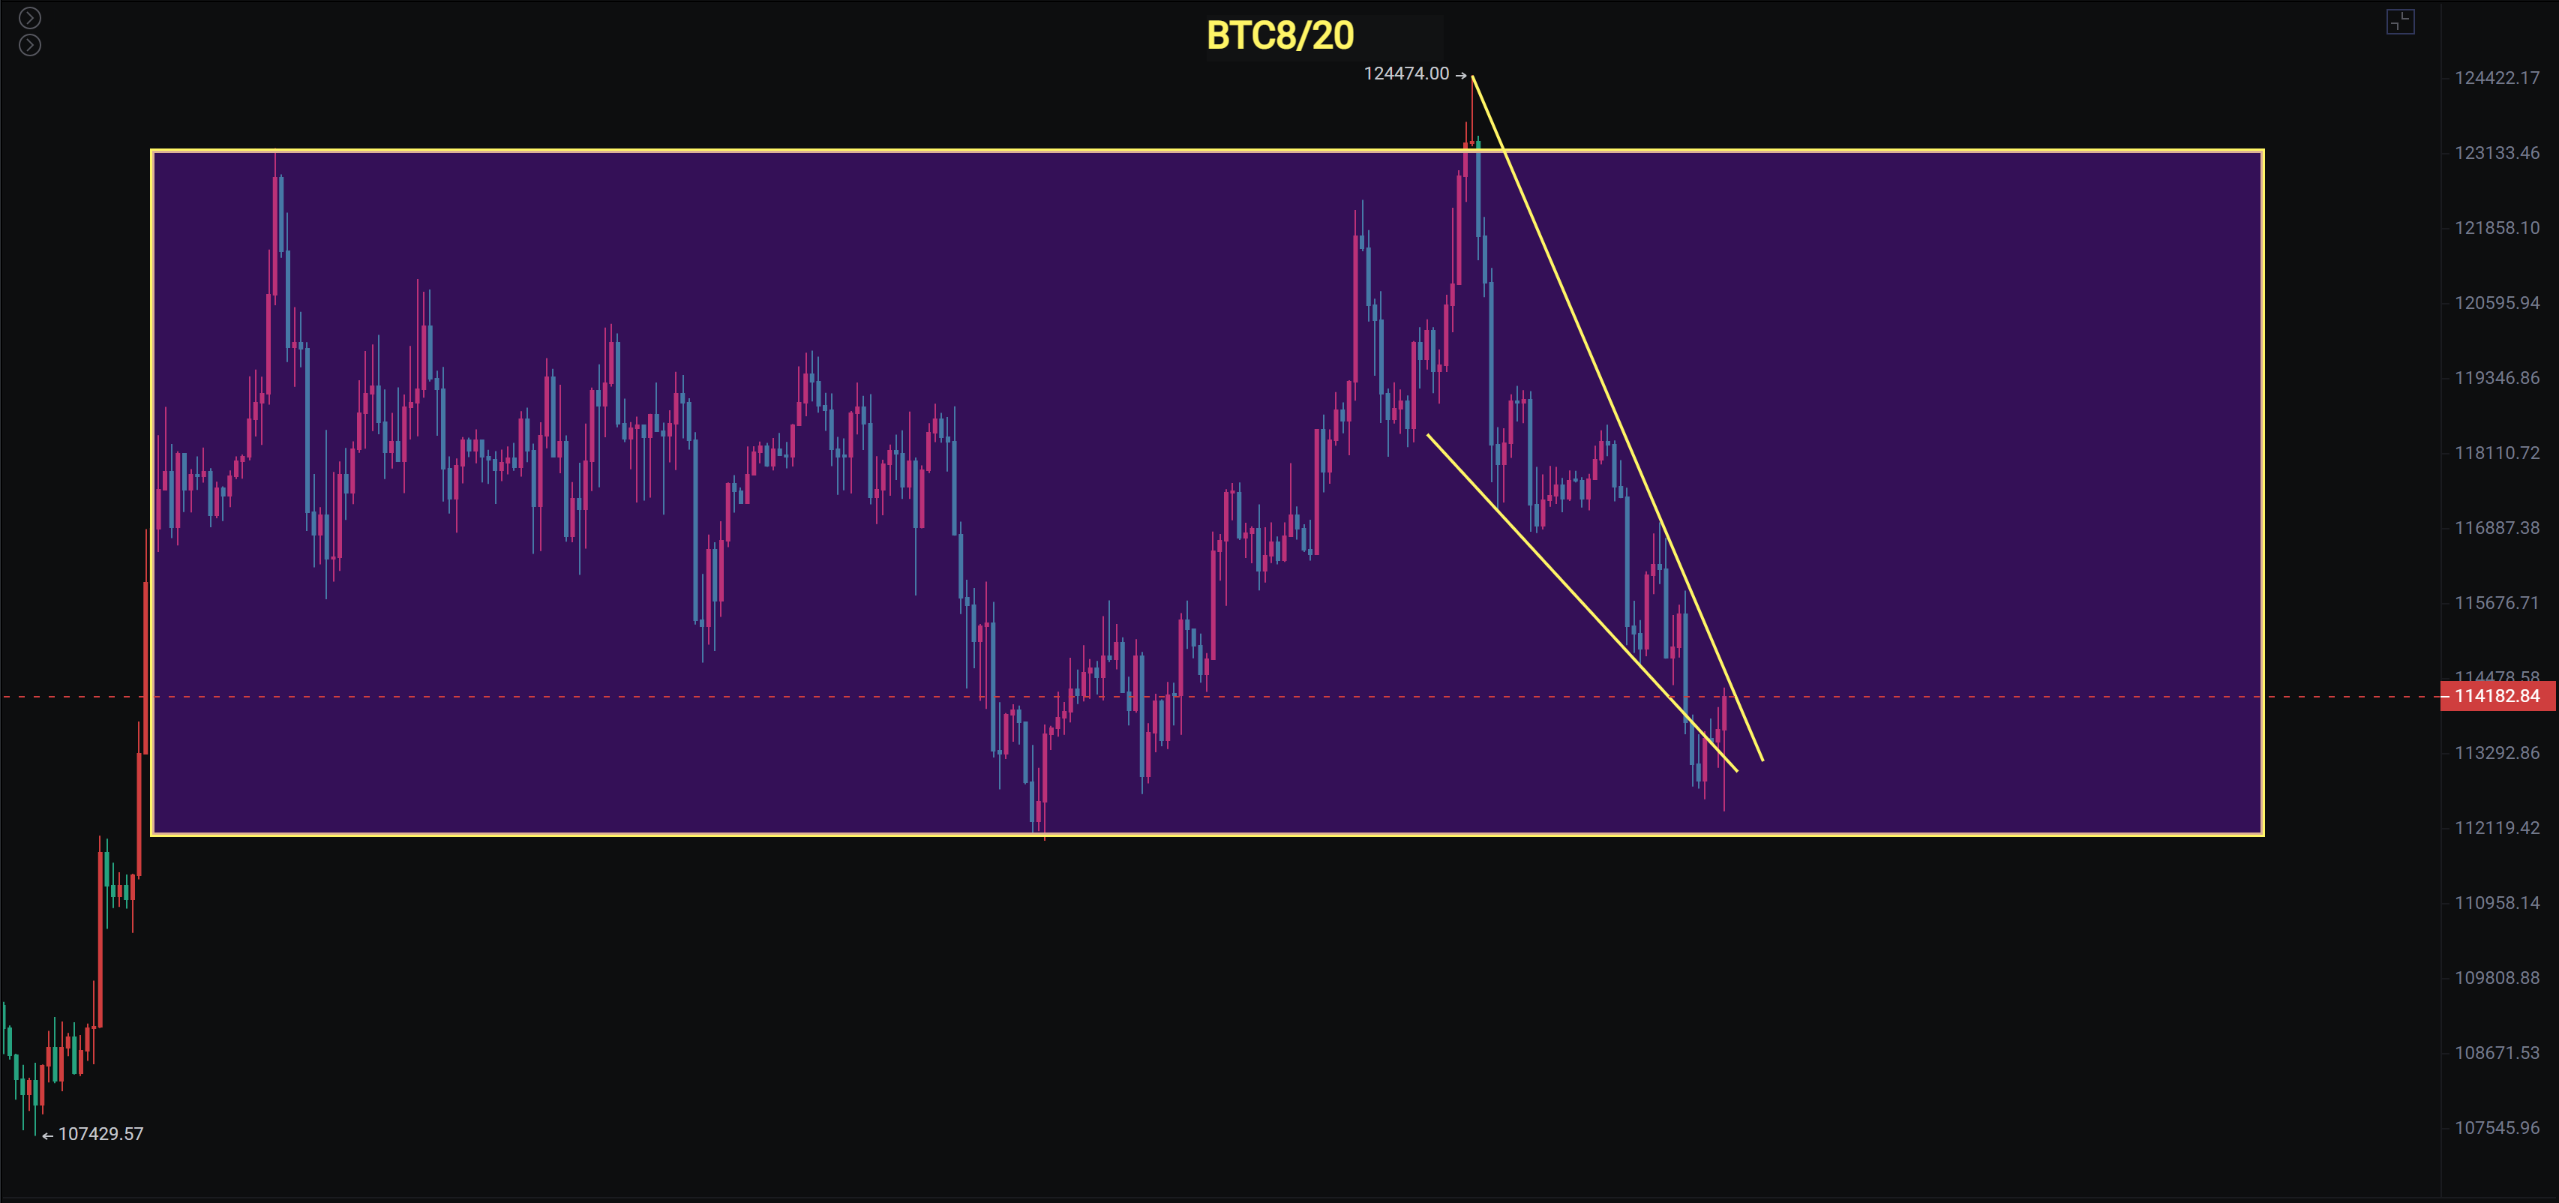
Bitcoin
Bitcoin has continued to decline for a week, reaching the previous support near 112000, which has short-term support. However, whether it can rebound depends on the strength of the rebound. Additionally, the continuous decline in U.S. stocks over the past two days will also affect Bitcoin. A left-side bet on a rebound cannot break below 119000. If a large bearish candle breaks below 119000, it is still necessary to exit the market.
On the daily chart, Bitcoin's upward trend has broken, and it is currently testing the support near the previous high of 119000. Pay attention to the short-term false breakdown opportunities after a break, but currently, the decline has not seen increased volume. The MACD has crossed below the zero line, and four days of adjustment is not enough. Based on the previous upward time cycle of about two weeks, there will be a significant rebound opportunity at the end of this month and the beginning of next month.
Support: 108000 to 100000
Resistance: 116000 to 118500 to 121000
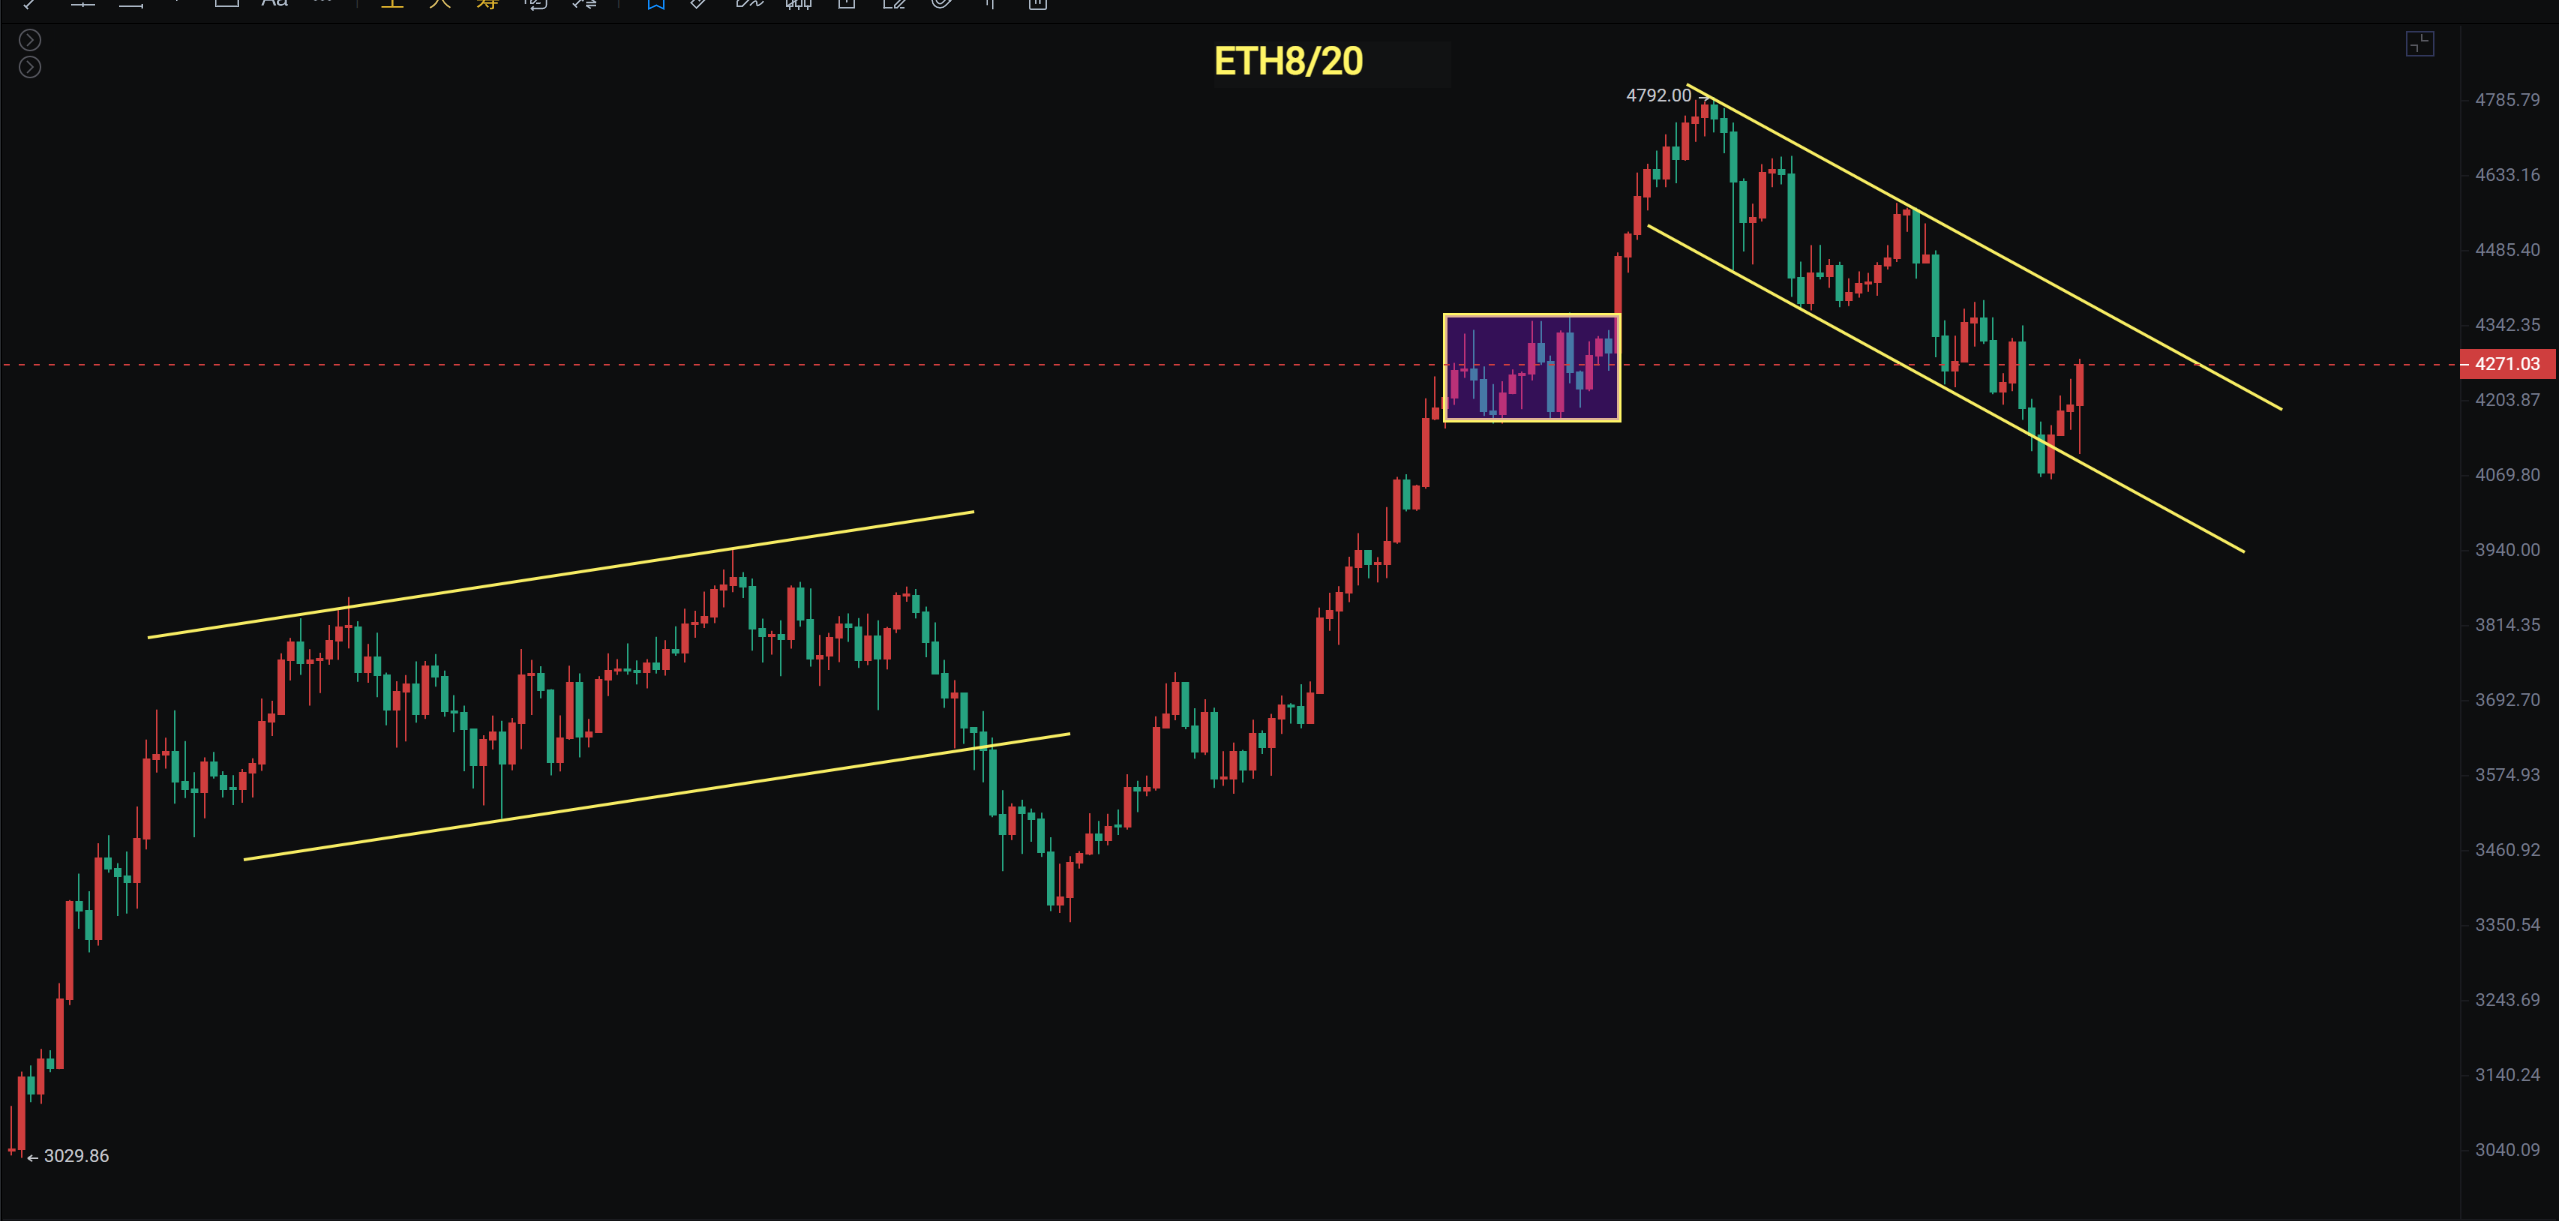
Ethereum
Ethereum has dropped to a low of 4060 and has broken the descending channel. It also followed the U.S. stock market down at the opening, then saw a spike rebound with resistance at 4360. The daily decline has touched the 20-day moving average, providing short-term support, but similarly, the decline has not seen increased volume. The MACD histogram has crossed below the zero line, and the fast and slow lines have crossed. Ethereum is slightly stronger than Bitcoin, and the upward trend line is still being tested, so we are also watching whether the support near Bitcoin's 119000 is effective.
The 4-hour chart maintains a descending channel and is currently testing the support of the previous breakout platform. If Bitcoin breaks below the support of 119000, given that the U.S. stock market is also in a pullback, it will likely decline further. During the day, Bitcoin's internal alert for left-side entry looks for a short-term rebound, and we will wait for clearer right-side entry signals.
Support: 3800 to 3950
Resistance: 4360 to 4660
If you like my views, please like, comment, and share. Let's navigate through the bull and bear markets together!!!
The article is time-sensitive and for reference only, updated in real-time.
Focusing on K-line technical research, sharing global investment opportunities. Official account: BTC Trading Prince Fusu

免责声明:本文章仅代表作者个人观点,不代表本平台的立场和观点。本文章仅供信息分享,不构成对任何人的任何投资建议。用户与作者之间的任何争议,与本平台无关。如网页中刊载的文章或图片涉及侵权,请提供相关的权利证明和身份证明发送邮件到support@aicoin.com,本平台相关工作人员将会进行核查。


