Cryptocurrency News
Hot Topics on August 20:
1. Today's Fear and Greed Index has dropped to 44, indicating a "fearful state."
2. Monad tops the Kaito Mindshare leaderboard, with a 24-hour Mindshare share of 51.11%.
3. SkyBridge Capital plans to tokenize its $300 million hedge fund on the Avalanche network.
4. The cost price of ETH held by BitMine and SharpLink Gaming is $2244 and $2300, respectively.
5. Multiple cryptocurrency industry associations jointly support the nomination of Brian Quintenz as the chairman of the U.S. CFTC.
Trading Insights
Share 4 hidden K-line signals from market makers to avoid 50% of the pitfalls!
False Breakout: The "Previous High Trap" set by market makers
① Characteristics: Price quickly falls back after reaching a previous high, with trading volume shrinking compared to the average of the previous 3 days (rather than increasing), akin to "hanging a false light" to lure in buyers.
② Key Distinction: A true breakout requires volume and price to move in sync, with volume at least 1.5 times the average of the previous 3 days; a false breakout only "touches" the previous high, with weak volume.Yin-Yang "Washing Pin": Emotional manipulation by market makers
The core observation is the position: At support levels (like MA60), the appearance of a "Yin Pin + Yang Pin" signals a washout of panic selling by market makers; at resistance levels (like previous highs), a "Yang Pin + Yin Pin" with increased volume on the Yin Pin (like 2 times) indicates a trap for buyers before selling off.Long-term Consolidation: Market makers' "Hawk" accumulation strategy
① Misconception: Consolidation is not a lack of movement, but a method for market makers to wear down retail investors' patience; the direction often reveals itself at the end of the consolidation.
② Technique: If consolidation lasts over 15 days, the breakout will be stronger; a true breakout requires simultaneous increases in volume and price, while a false breakout sees price rise with shrinking volume (market makers "drawing a door").Sharp Top vs. Round Bottom: Signals for "selling" and "accumulating" by market makers
① Sharp Top (Selling): A rapid rise followed by a sharp drop forms a "sharp knife" shape, often accompanied by massive volume (trading volume exceeding 3 times the usual), leaving little time for exit.
② Round Bottom (Accumulating): A slow grind up forms a "round pot" shape, requiring low volume (trading volume reduced to below 50% of the average of the previous 3 months).
Final Reminder: K-lines are the "footprints" of market makers. While these patterns are not 100% accurate, mastering them can help avoid at least half of unnecessary losses. Now, open the K-line chart for comparison, and you may discover signals you previously missed. The cryptocurrency market is a game of hunters and prey; understanding the "subtext" can help you avoid being harvested and take more control.
LIFE IS LIKE
A JOURNEY ▲
Below are the real trading signals from the Big White Community's group this week. Congratulations to those who followed along; if your trades are not going well, you can come and test the waters.
The data is real, and each trade has a screenshot from when it was issued.
**Search for the public account: *Big White Talks About Coins*
BTC
Analysis
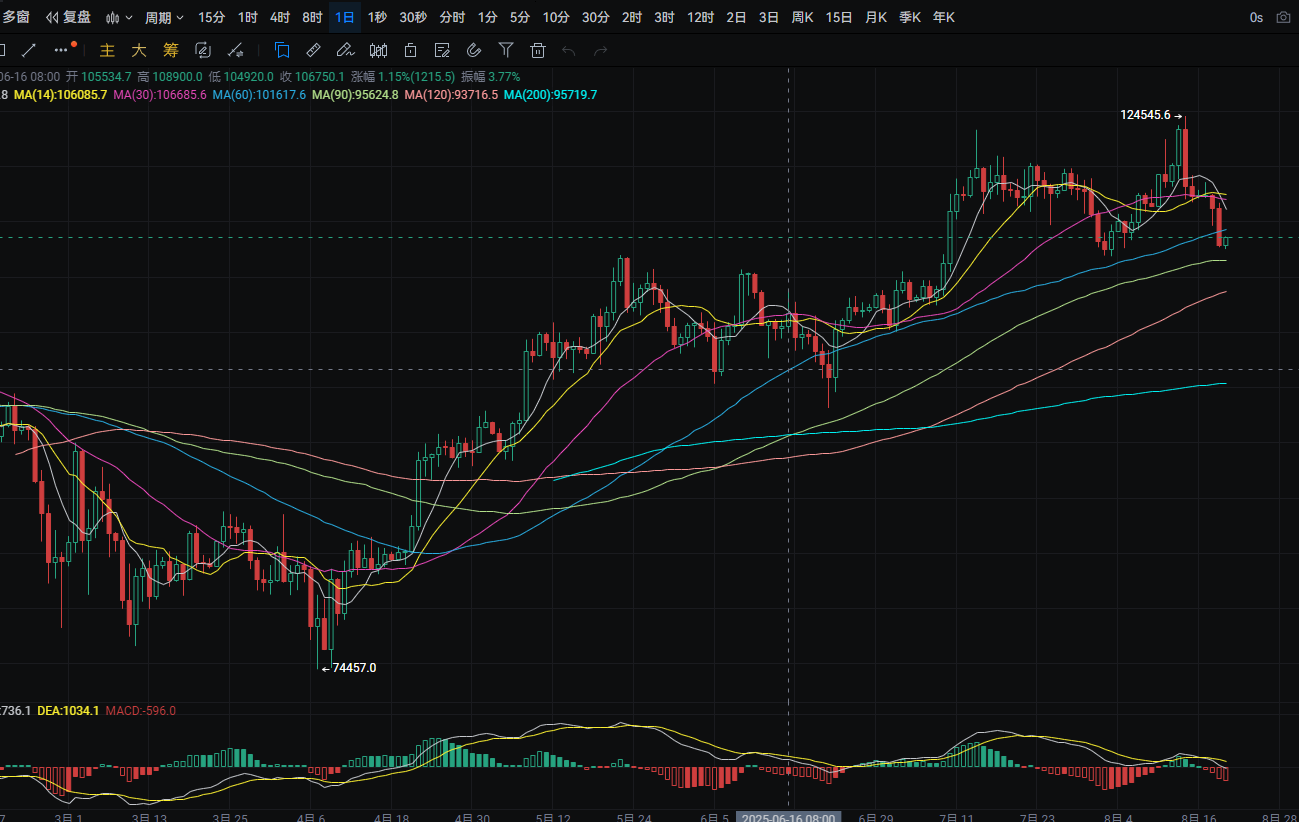
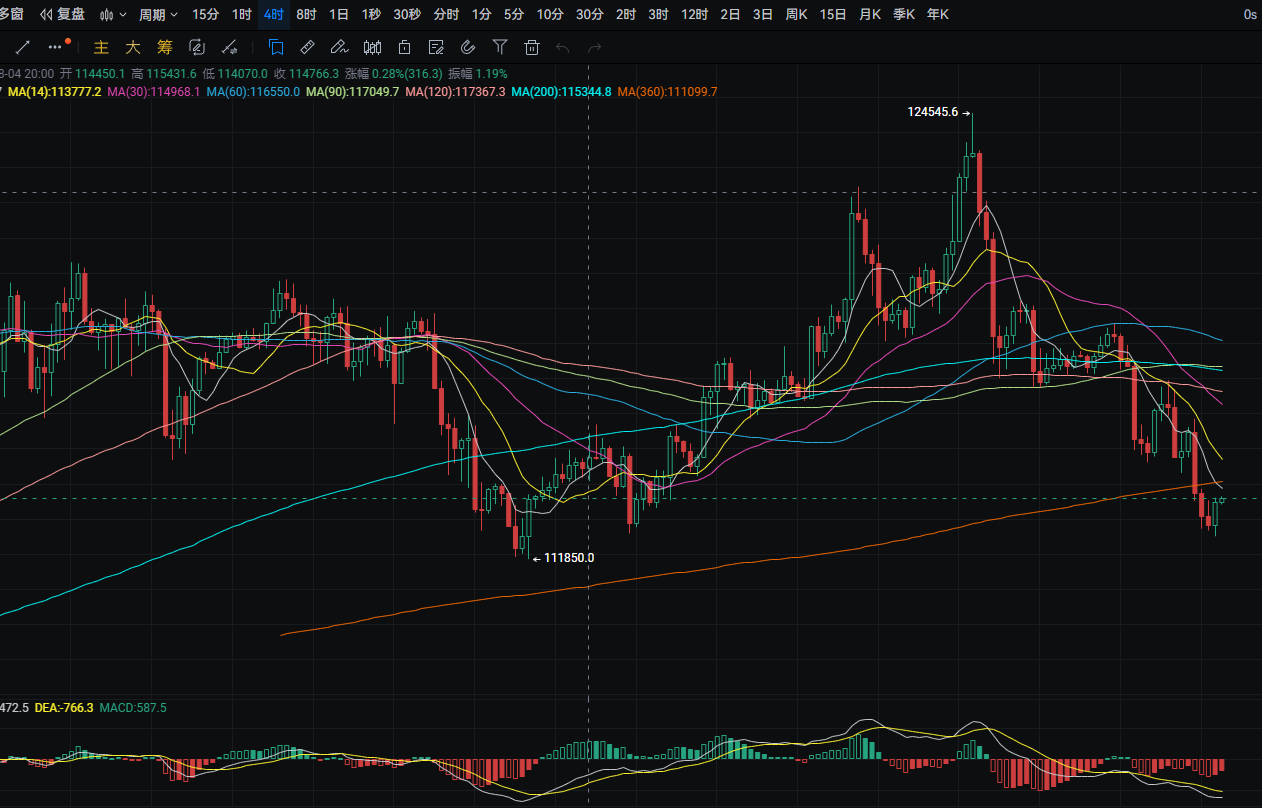
Yesterday, Bitcoin's daily line fell from a high of around 116700 to a low of 112650, closing around 112800. The support level is near MA90; if it breaks, it could drop to MA120. A pullback can be used to buy near this level. The resistance level is near the MA7 moving average; if it breaks, it could rise to around 118650. A rebound near this level can be used to sell. MACD shows increasing bearish momentum. The four-hour support level is near 112500; if it breaks, it could drop to around 111350. A pullback can be used to buy near this level. The resistance level is near MA360; if it breaks, it could rise to around 115450. A rebound near this level can be used to sell. MACD shows decreasing bearish momentum.
ETH
Analysis
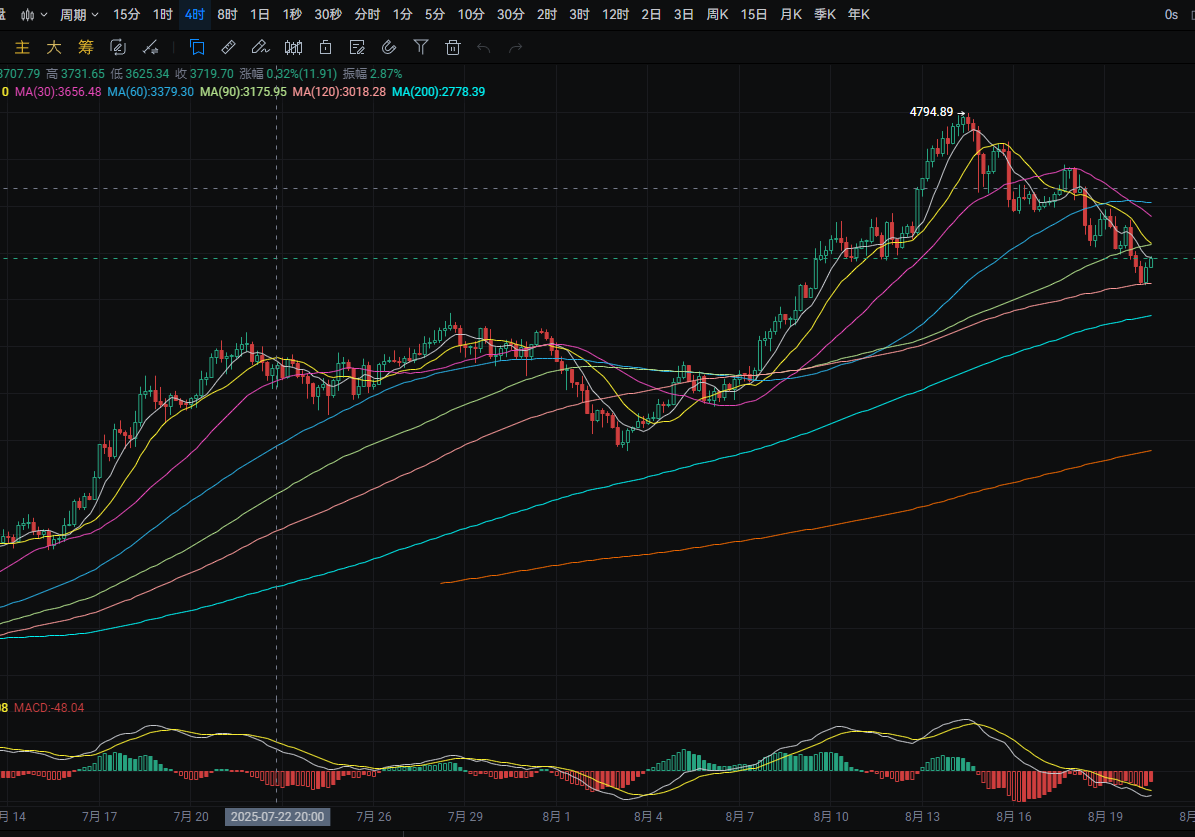
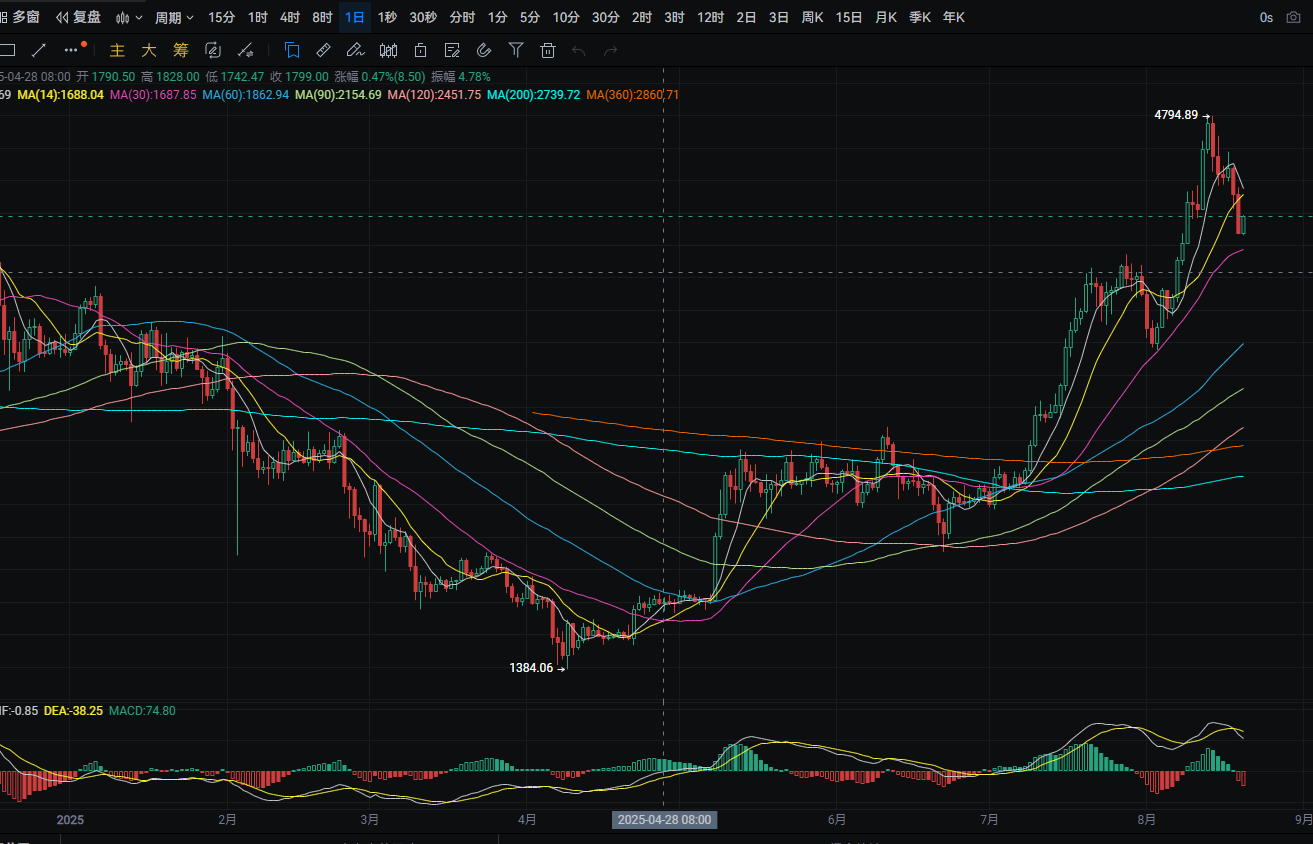
Ethereum's daily line fell from a high of around 4355 to a low of around 4065, closing around 4075. The support level is near MA30; if it breaks, it could drop to around 3780. A pullback can be used to buy near this level. The resistance level is near MA14; if it breaks, it could rise to around 4480. A rebound near this level can be used to sell. MACD shows increasing bearish momentum, forming a death cross. The four-hour support level is near MA120; if it breaks, it could drop to MA200. A pullback can be used to buy near this level. The resistance level is near MA90; if it breaks, it could rise to MA30. A rebound near this level can be used to sell. MACD shows decreasing bearish momentum.
Disclaimer: The above content is personal opinion and for reference only! It does not constitute specific trading advice and does not bear legal responsibility. Market conditions change rapidly, and the article may have some lag; if you have any questions, feel free to consult.
免责声明:本文章仅代表作者个人观点,不代表本平台的立场和观点。本文章仅供信息分享,不构成对任何人的任何投资建议。用户与作者之间的任何争议,与本平台无关。如网页中刊载的文章或图片涉及侵权,请提供相关的权利证明和身份证明发送邮件到support@aicoin.com,本平台相关工作人员将会进行核查。


