
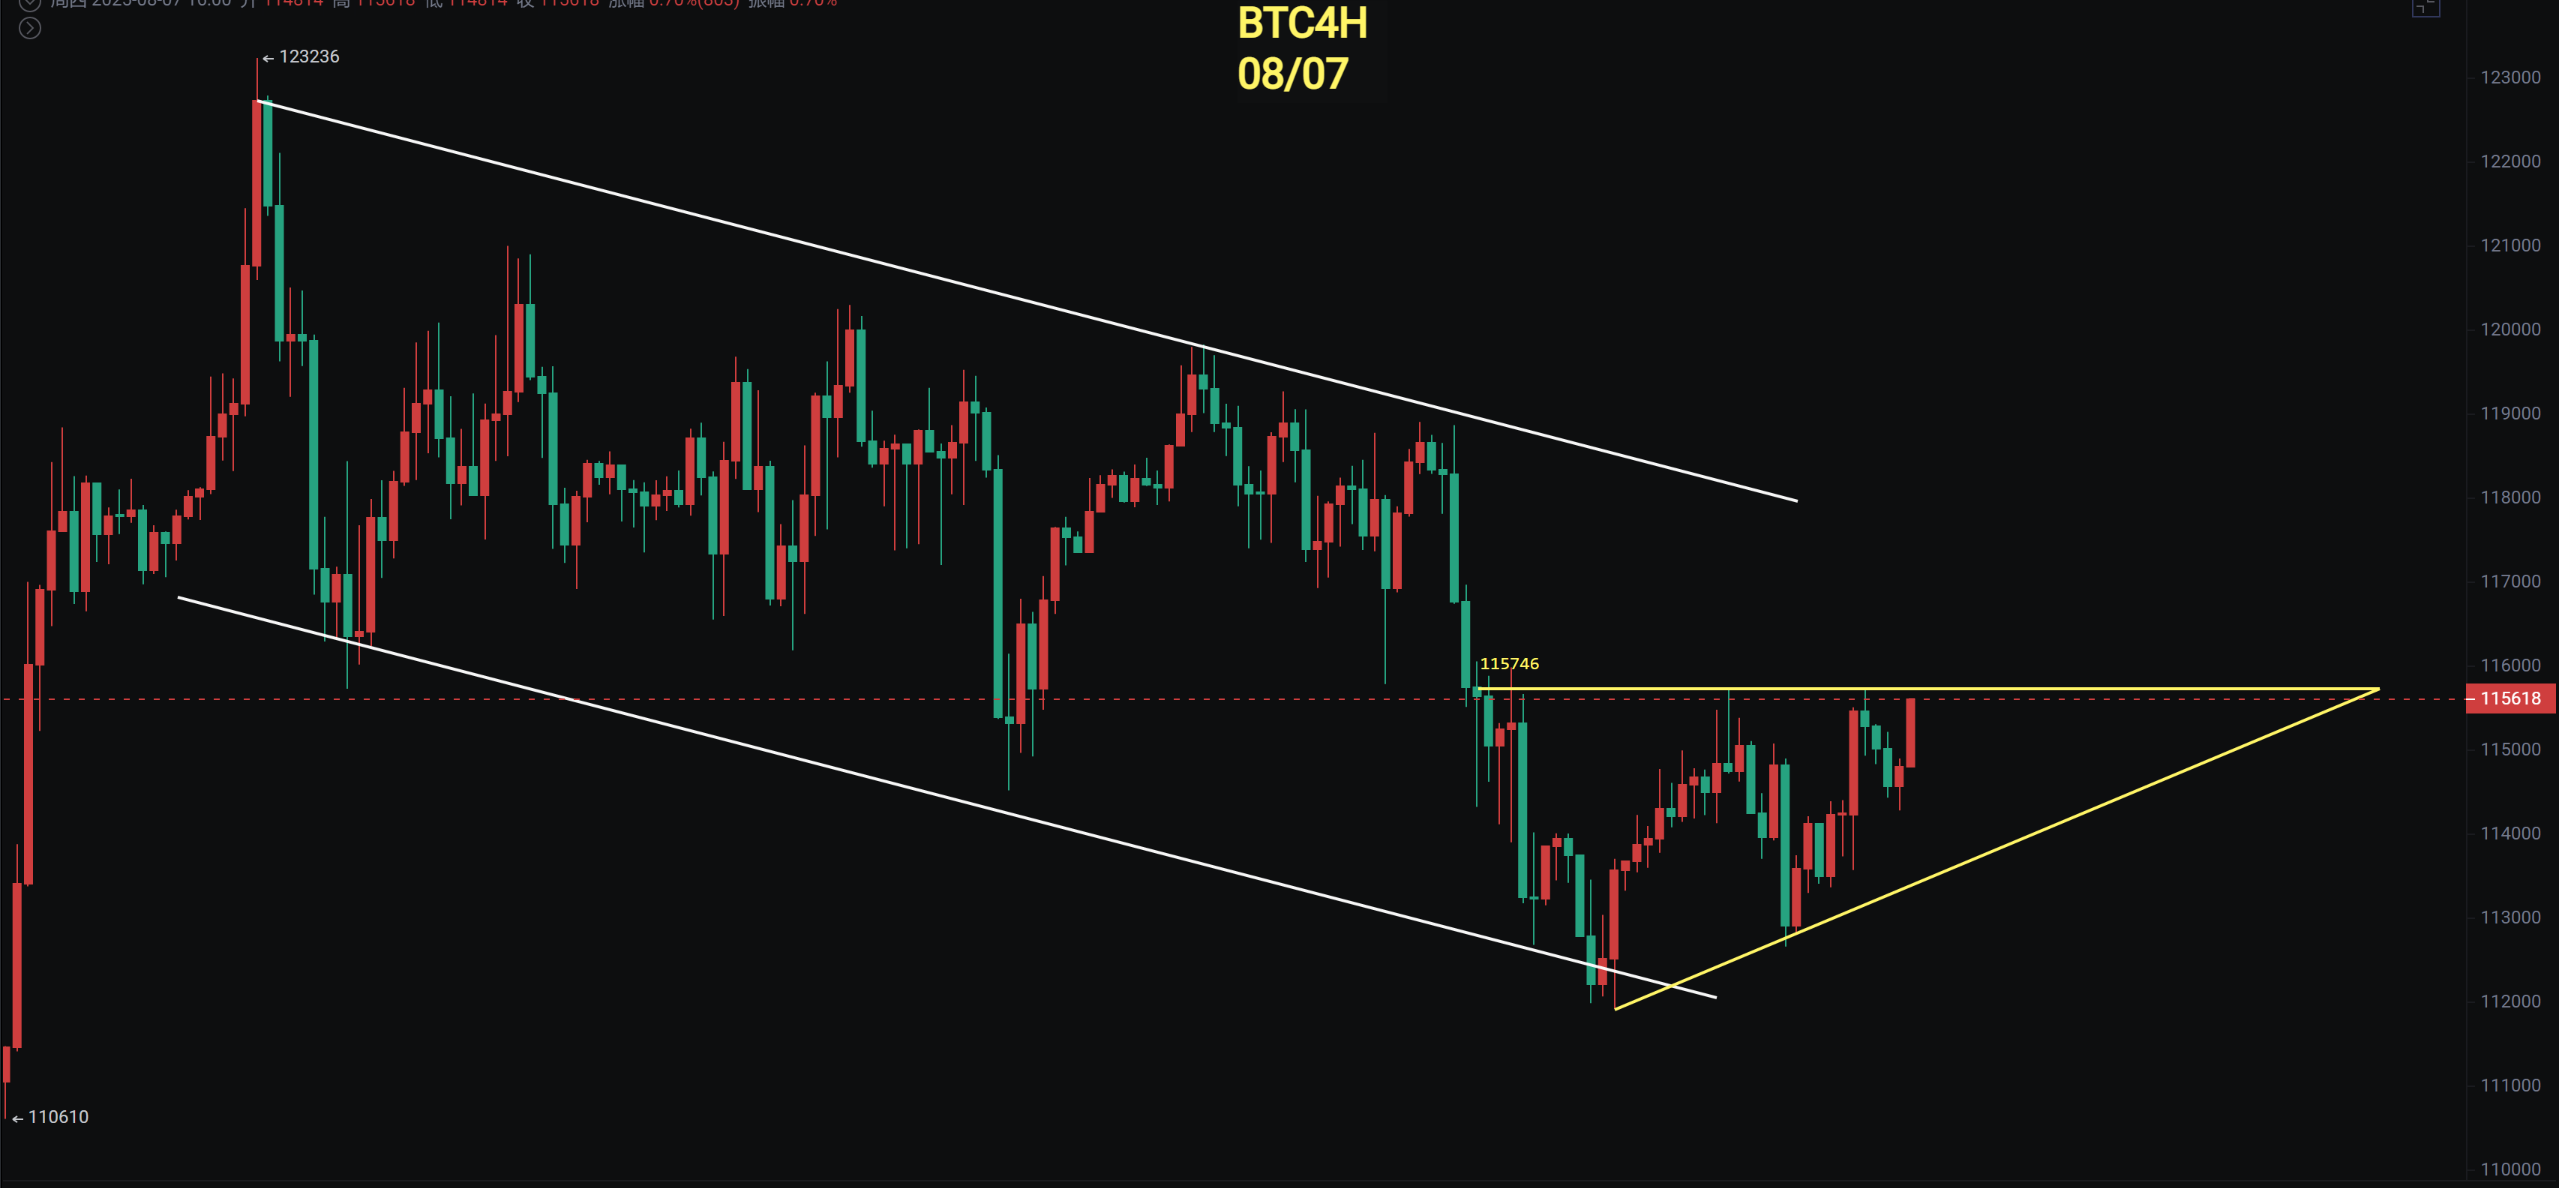
Bitcoin broke through 116,000 at 6 PM, reaching a high of 116,800, and has since pulled back to test support. Therefore, it is crucial that the next pullback stays above 116,000 for this breakout to be valid. The previous daily support levels of 114,700 and 115,700 must be maintained for the bulls to continue. The harmonic pattern mentioned yesterday at 0.886 points to 118,000, but it is still within a descending channel for now.
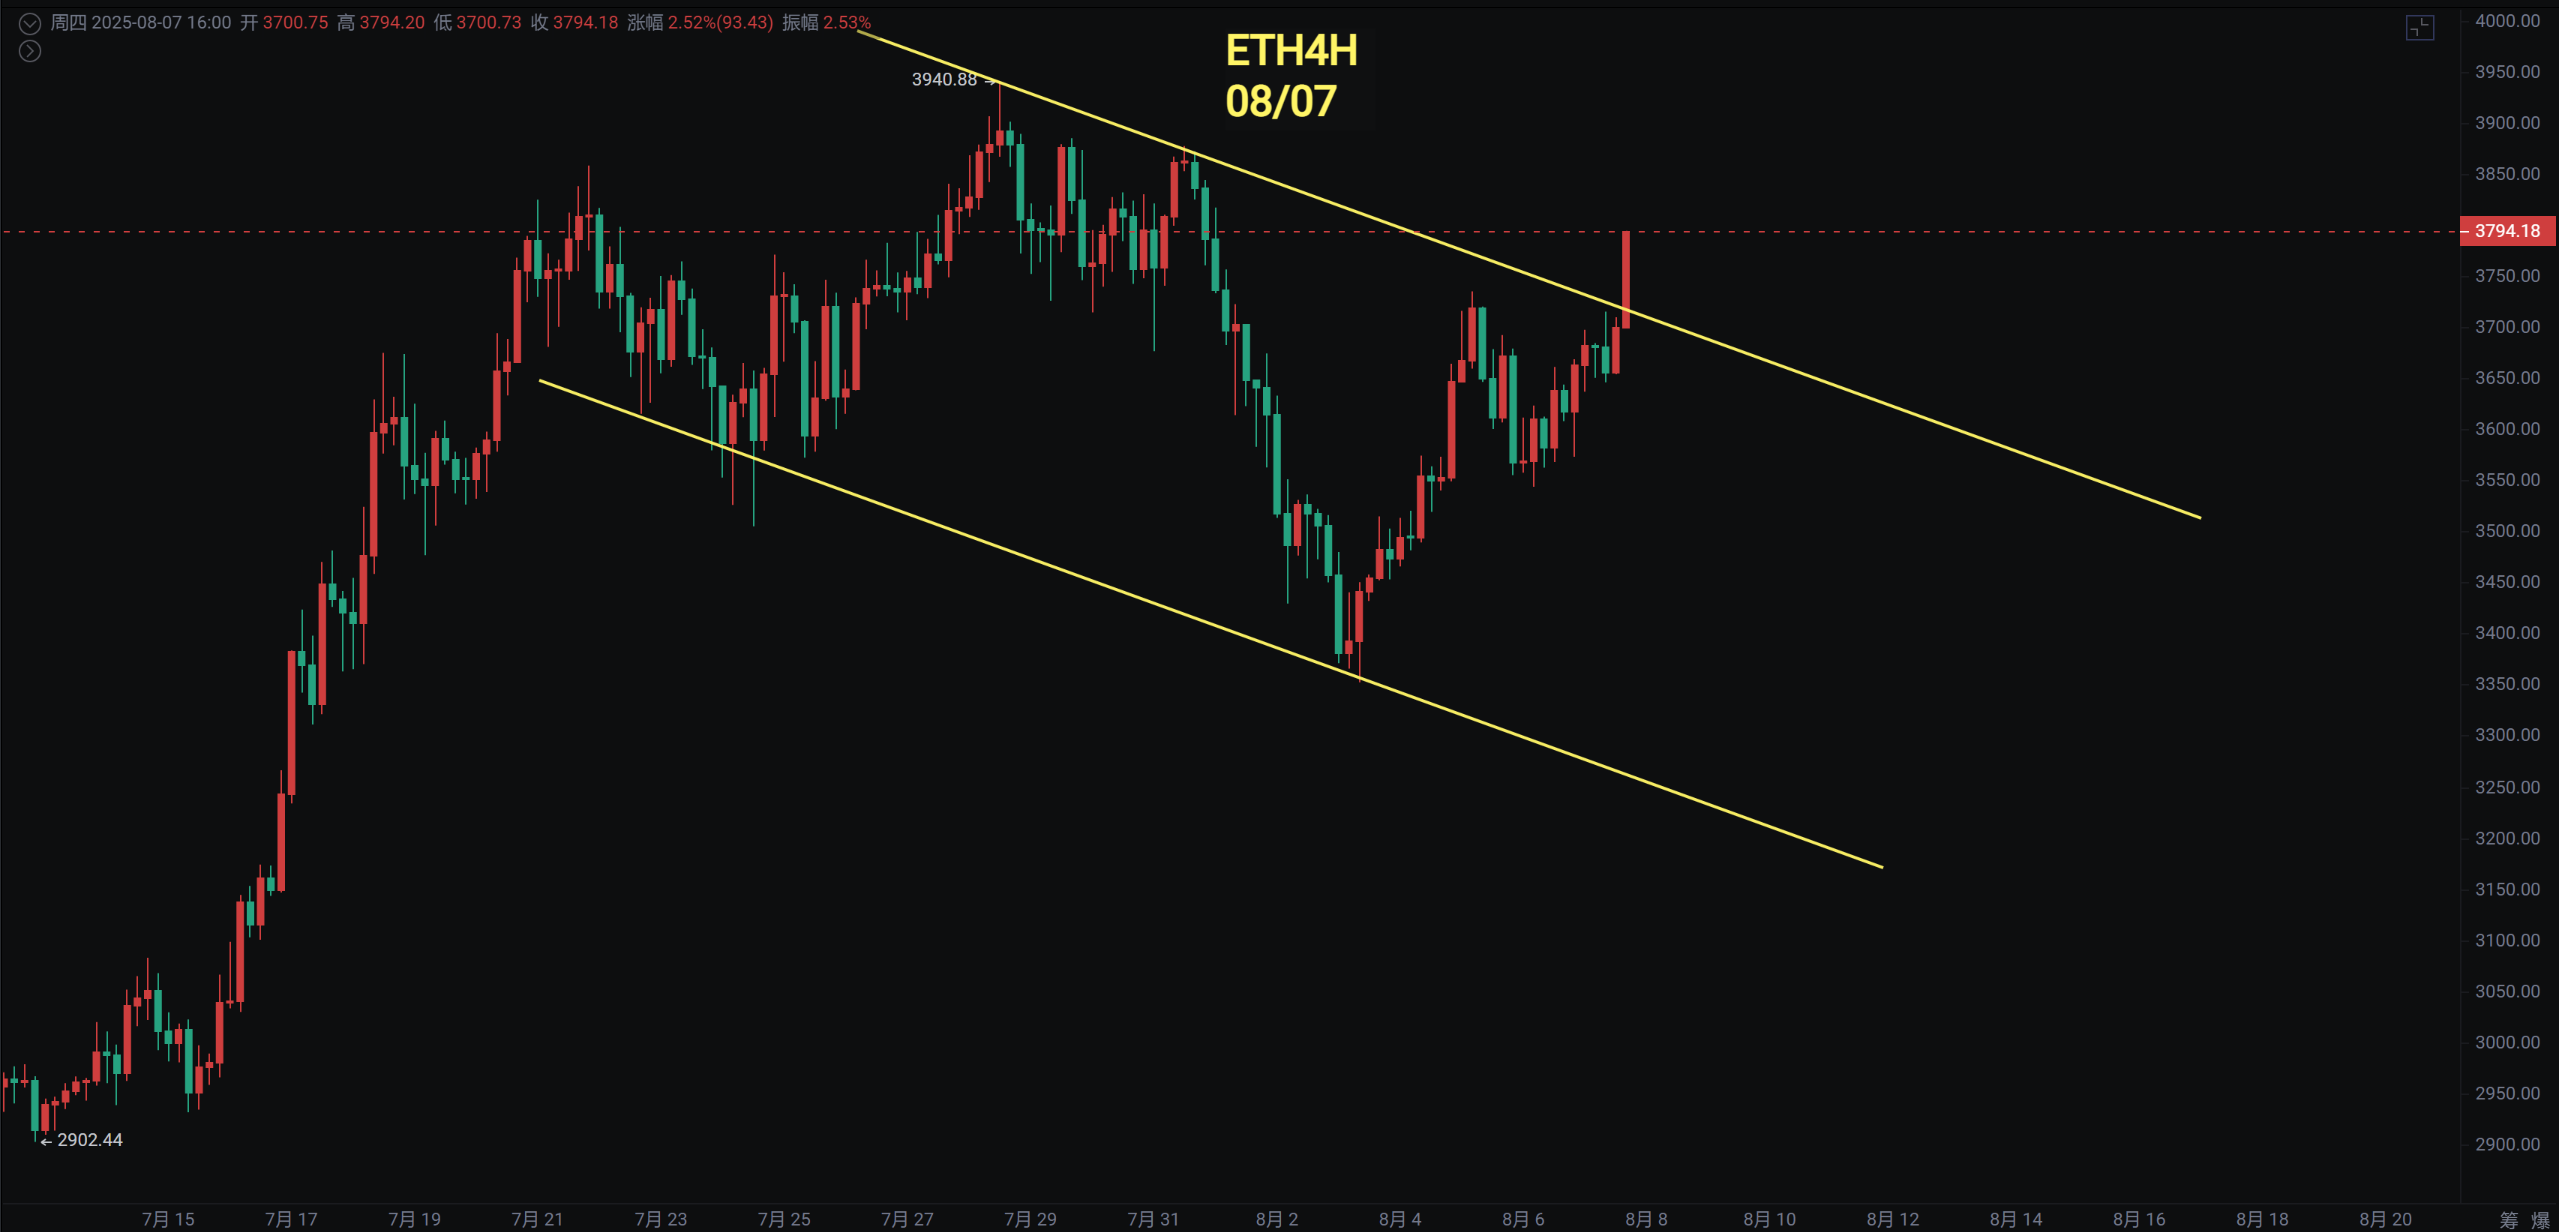
Ethereum has broken through its descending channel, currently priced at 3,846, returning to the vicinity of previous highs, with the ETH/BTC exchange rate reaching a new high of 0.3312. Since the reminder on August 3, the increase has exceeded 11%.
Bitcoin
The daily MACD histogram is continuously shortening, and the fast and slow lines have not yet crossed. This change has been anticipated for a long time, as we wait to see when it can cross the zero line and trigger a new round of market movement. The KDJ has formed a golden cross upwards, breaking through the triangular pattern at 116,000 in the afternoon.
For now, it has returned to the range above 114,700 and 115,700, while still within the flag channel. A few days ago, it was mentioned that the second scenario of the harmonic pattern points to 118,000. Therefore, we still need to pay attention to not falling back below 116,000, maintaining a bullish outlook.
Support: 115,000 - 116,000
Resistance: 118,000 - 121,000
Ethereum
Ethereum is showing strong momentum, having broken through the 4-hour descending channel, and is now near previous highs. The daily KDJ has crossed, the MACD histogram is shortening, and there are signs of a crossover in the fast and slow lines. The ETH/BTC exchange rate has also risen to a high of 0.3312.
The daily chart has broken through the 20-day moving average, and the pullback still suggests a bullish outlook, with the possibility of testing resistance between 4,000 and 4,100. Bitcoin is currently facing resistance at the 20-day moving average; if it can effectively hold above this level, there is a significant probability of continuing to rise, maintaining a buy-on-dips strategy.
Support: 3,550 - 3,750
Resistance: 3,940 - 4,100
If you like my views, please like, comment, and share. Let's navigate through the bull and bear markets together!!!
This article is time-sensitive and for reference only, with real-time updates.
Focusing on K-line technical research, sharing global investment opportunities. Official account: BTC Trading Prince Fusu

免责声明:本文章仅代表作者个人观点,不代表本平台的立场和观点。本文章仅供信息分享,不构成对任何人的任何投资建议。用户与作者之间的任何争议,与本平台无关。如网页中刊载的文章或图片涉及侵权,请提供相关的权利证明和身份证明发送邮件到support@aicoin.com,本平台相关工作人员将会进行核查。


