
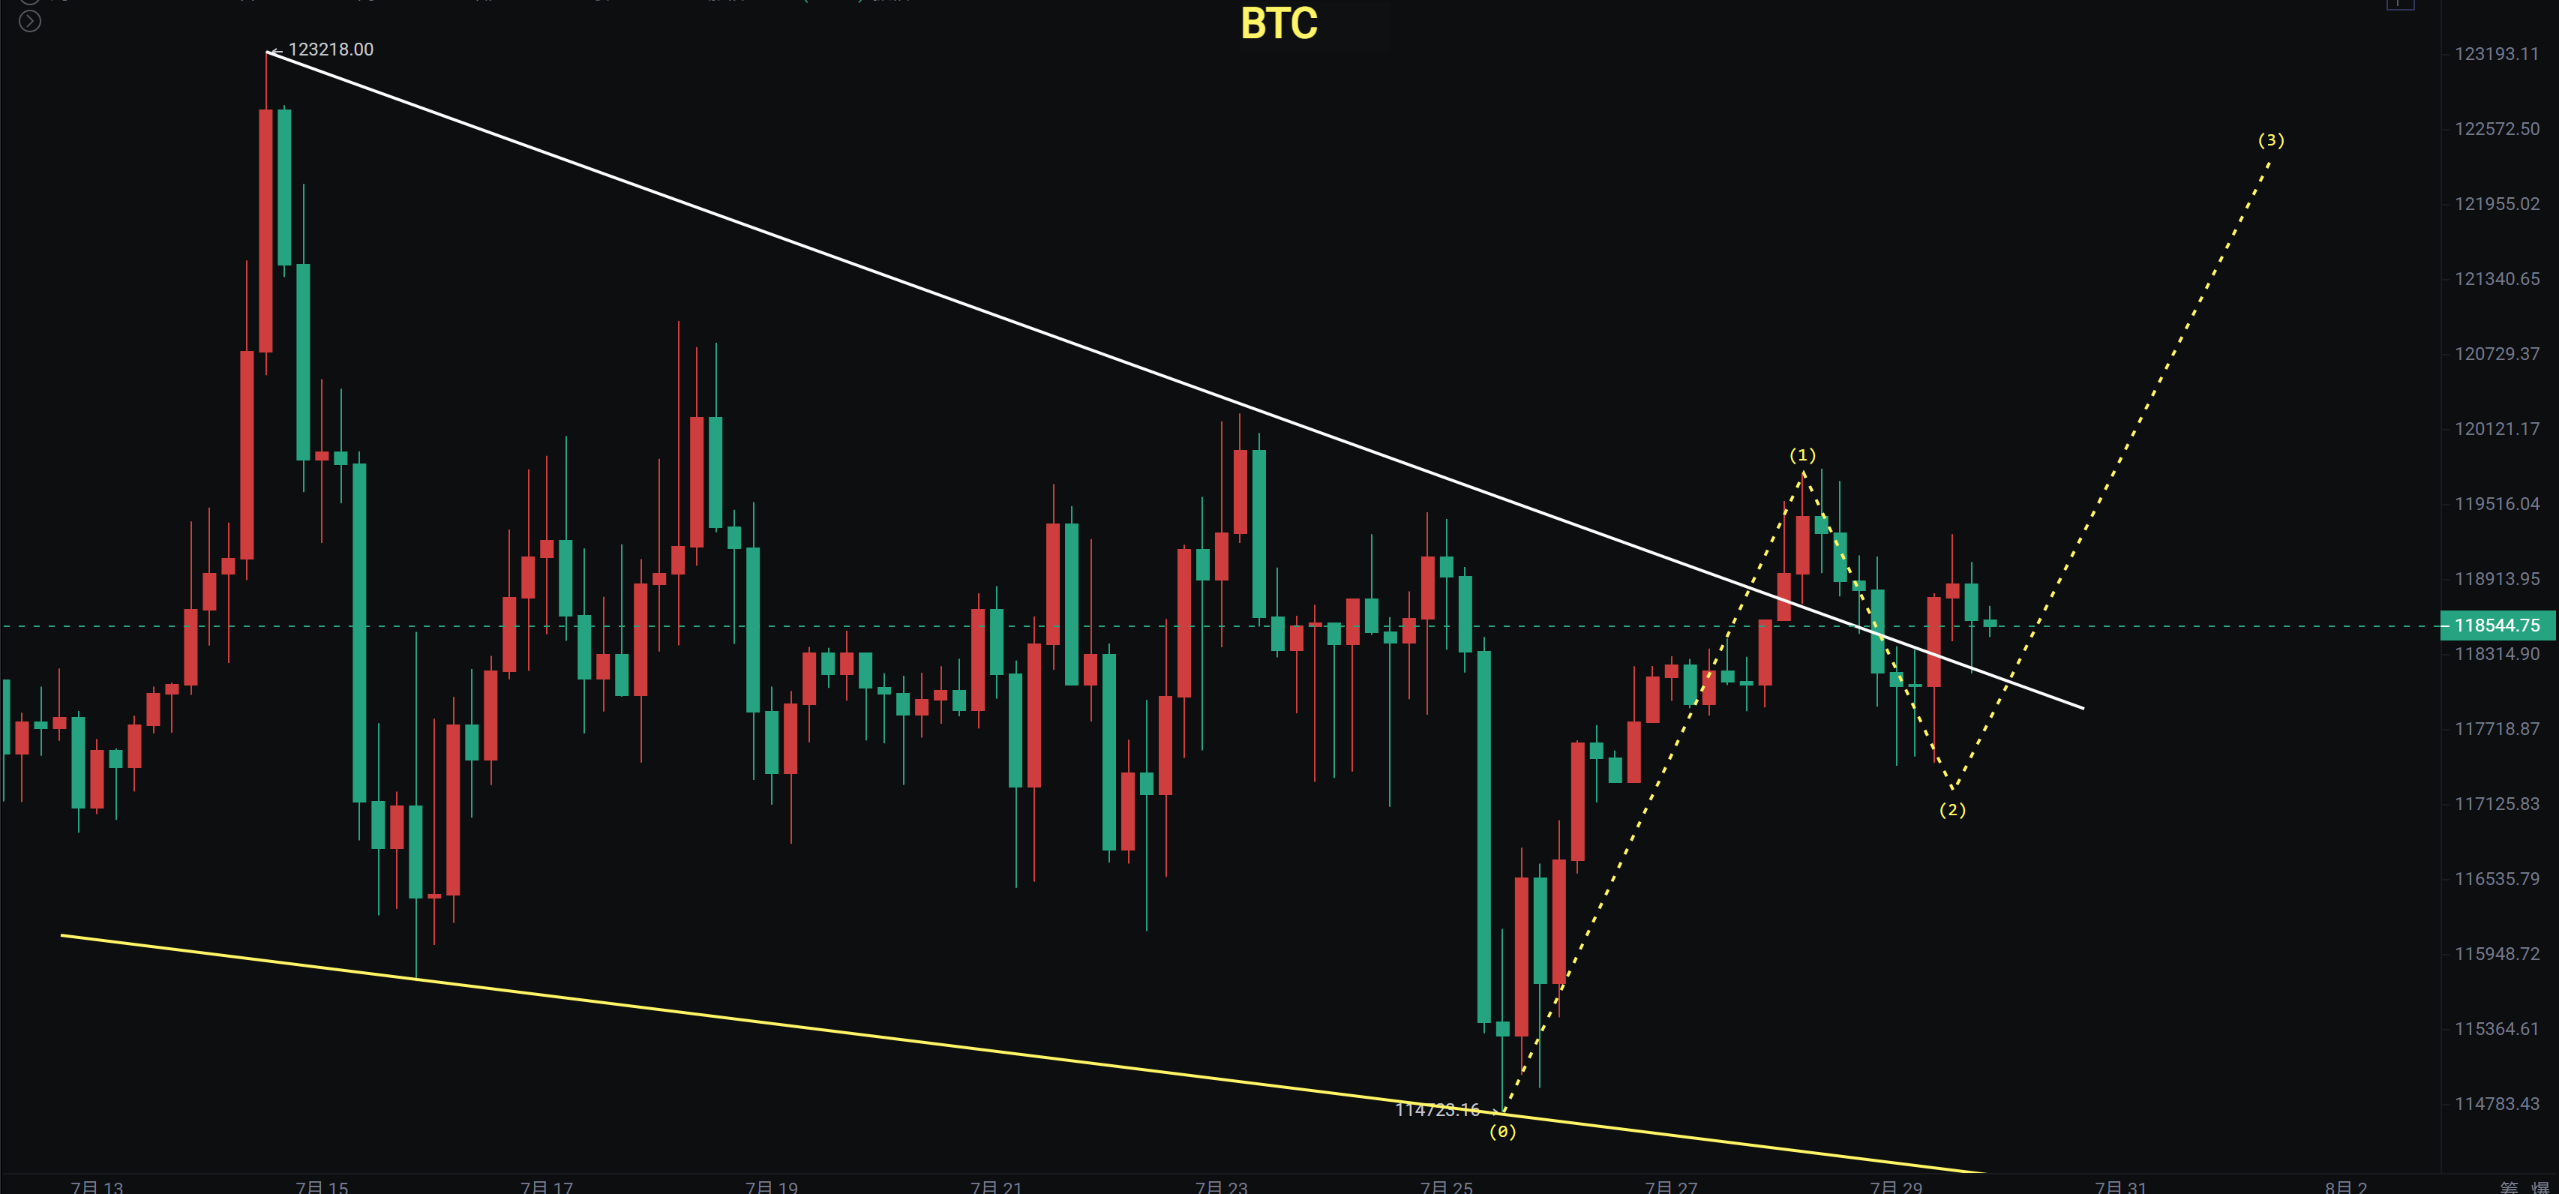
Bitcoin's daily chart shows a false breakdown, with a 4-hour descending wedge breakout and retest. The monthly chart is about to close, so be aware that volatility will be significant in the coming days. Pay attention to the change cycle in the first week of next month.
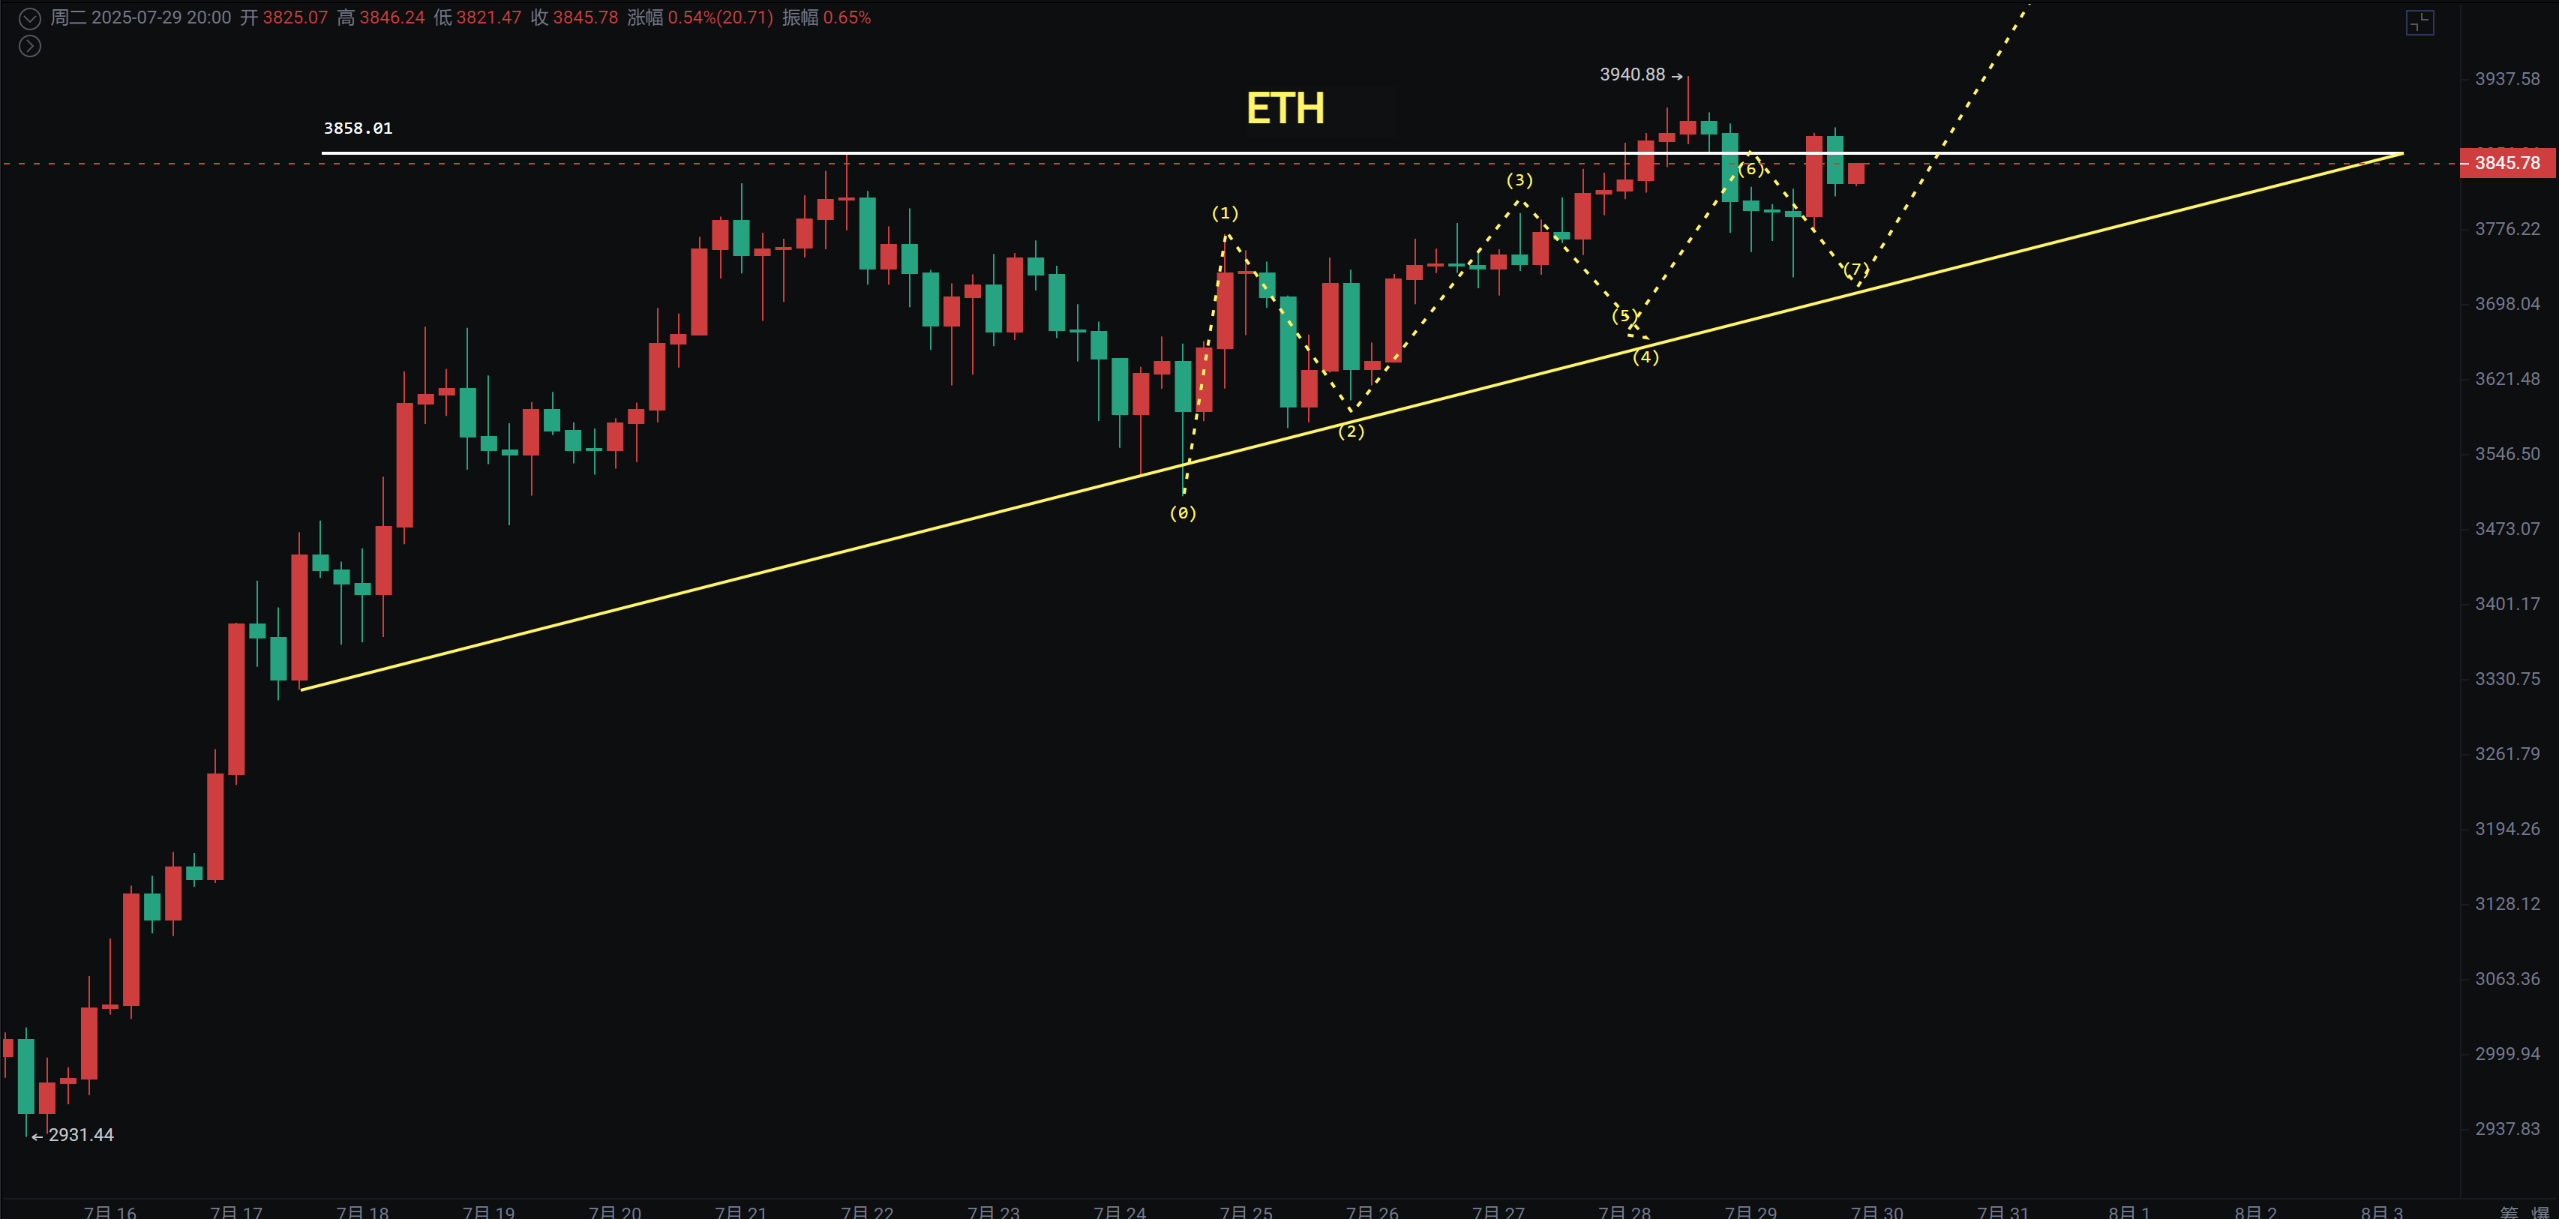
Ethereum reached a new high yesterday and is currently retracing, with the lowest point dropping to around 3700 before a short-term rebound. The previously mentioned 4-hour ascending triangle is still in play.
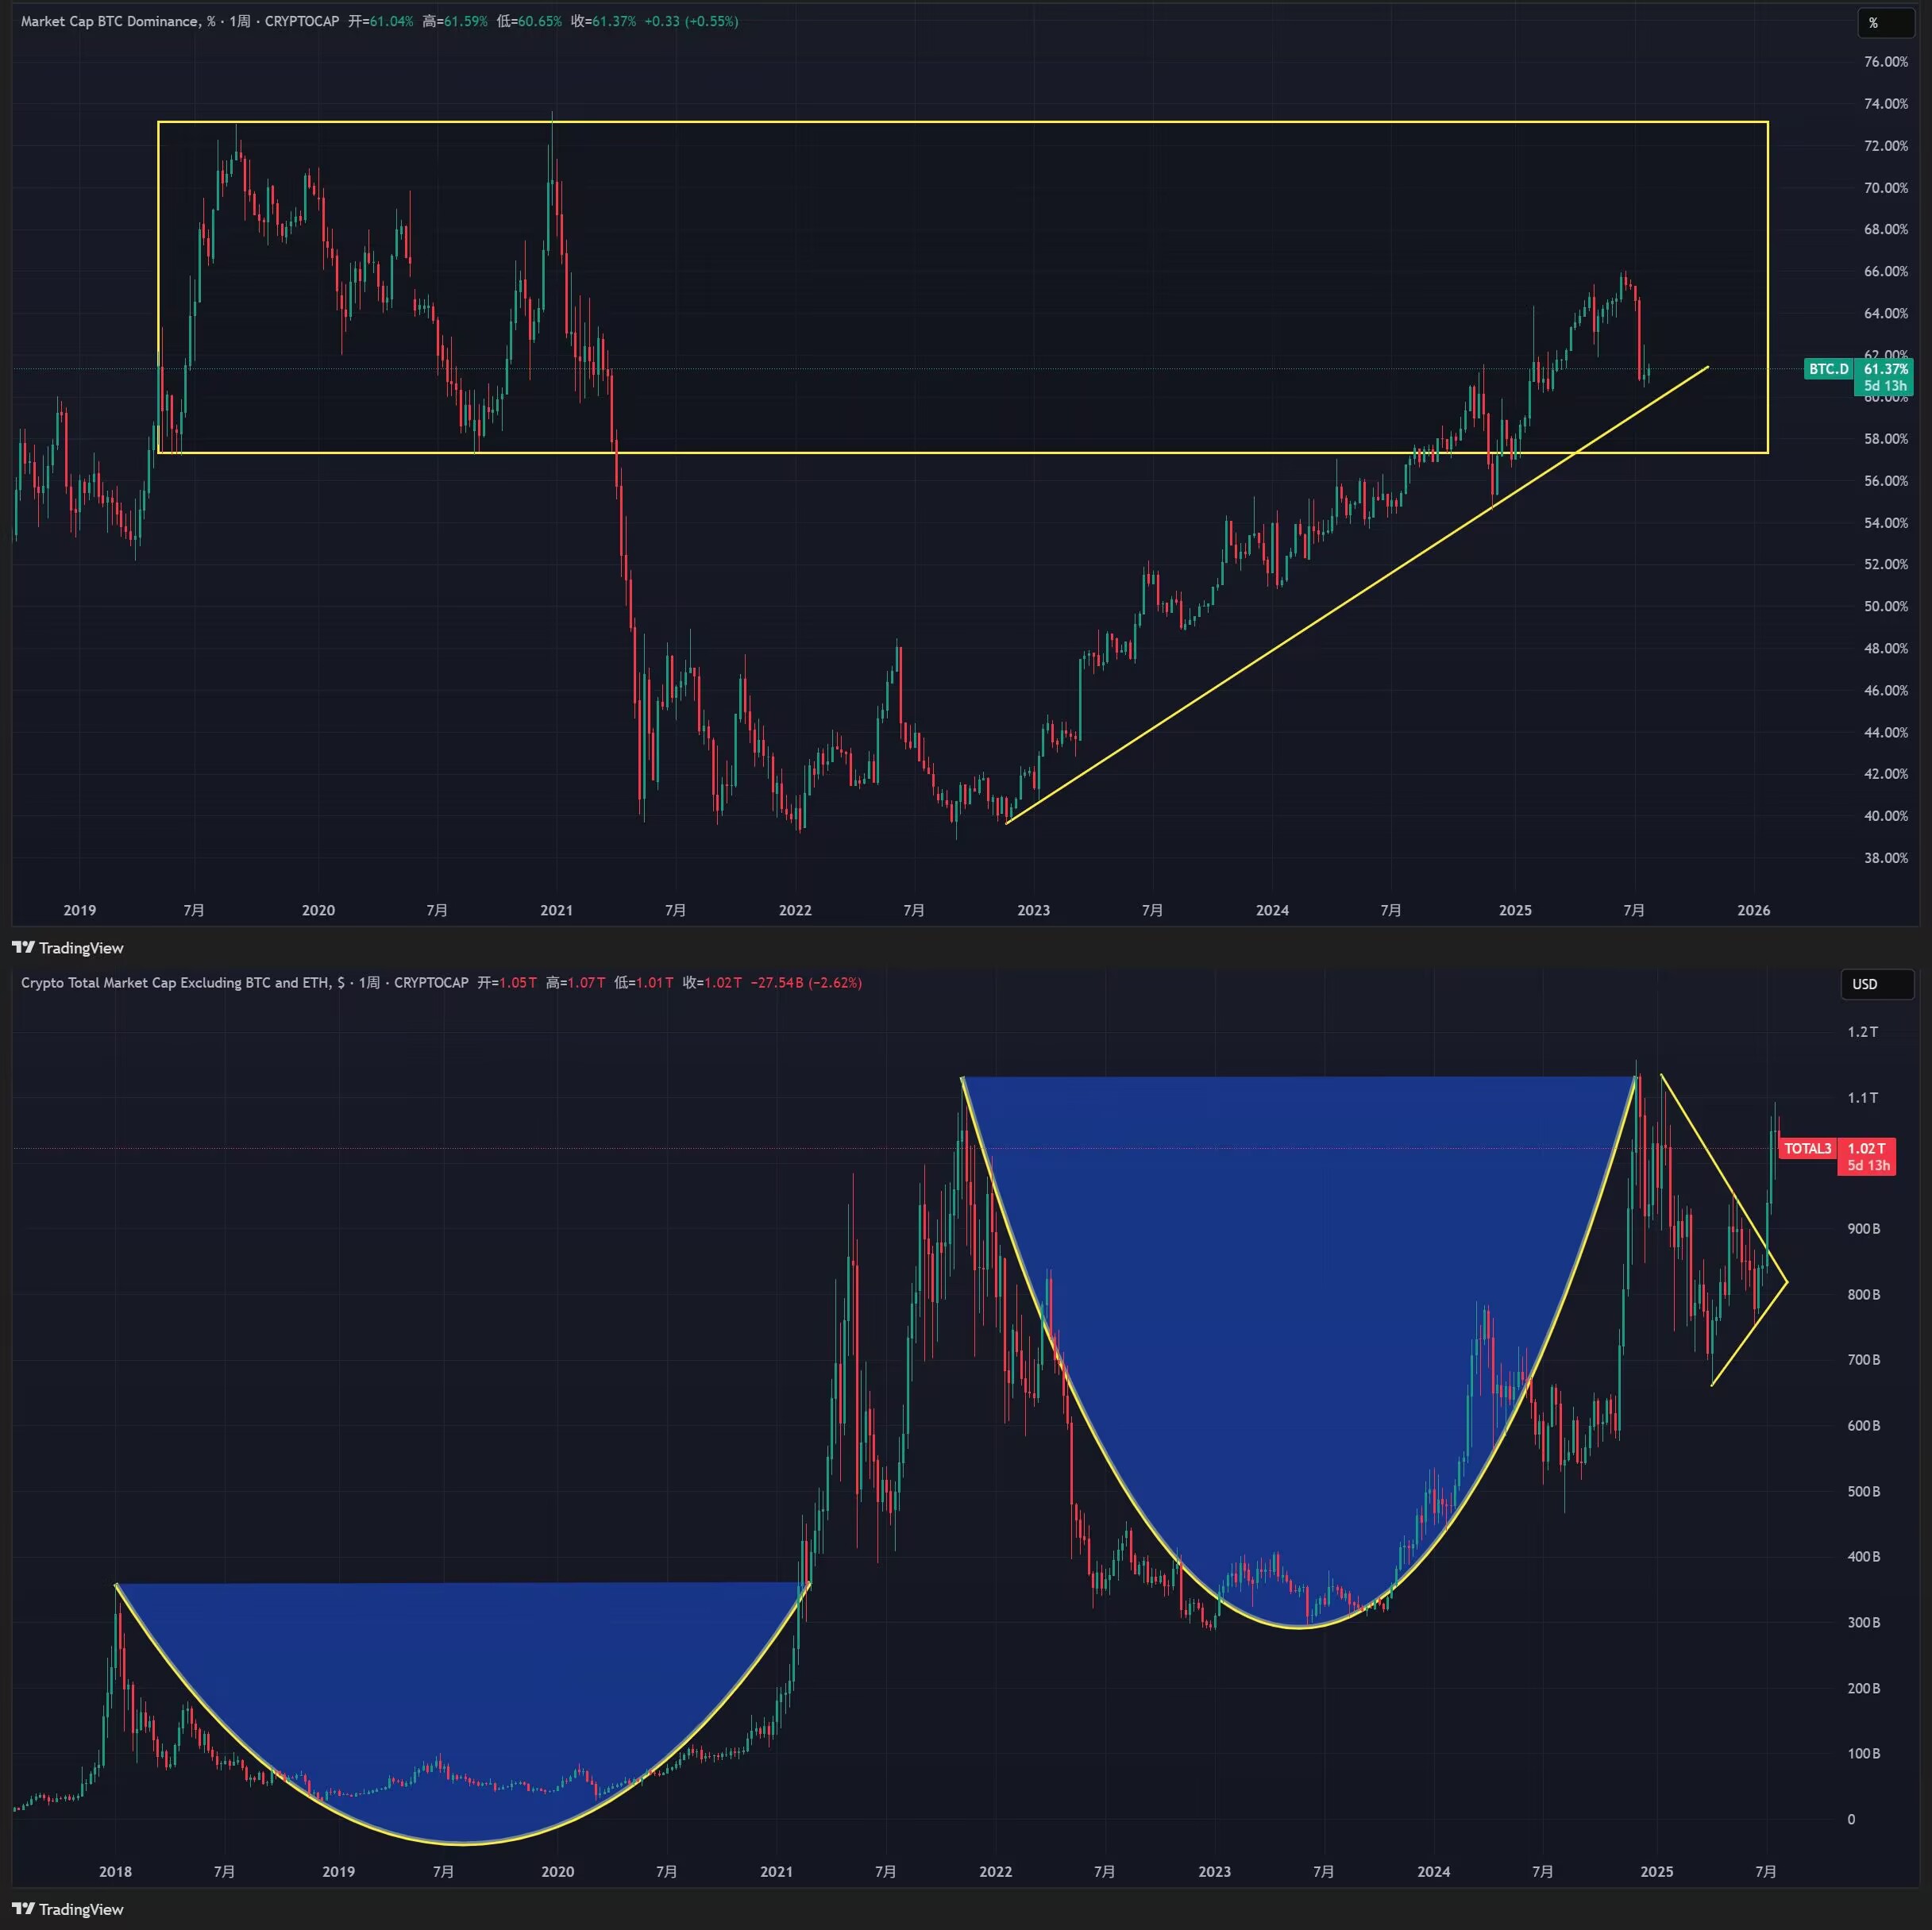
Today, I want to discuss a few indicators. The first is BTC D, which represents Bitcoin's market cap dominance. Many people believe Bitcoin has peaked and is due for a correction, but my perspective has always been that since 2021, Bitcoin has been leading the market. Although there has been a 10% correction in the last week or two, it remains above the upward trend line and has not broken down. It is still within this range, so whether it has peaked is still uncertain. If it continues to rebound and fails to create a new high before dropping again, then we can consider the probability of BTC D peaking to be quite high.
The second indicator is TOTAL3, which represents the market cap of altcoins. Currently, we can see it has approached previous highs but still needs a bit more height to break through. Therefore, I believe we need to focus on Ethereum and strong altcoins in the second half of the year.
Bitcoin's weekly chart is forming a doji star, indicating a strong performance. Although the daily chart had a false breakdown and then recovered, it still has not broken the resistance at 121000. The daily MACD is still below the zero line with the fast and slow lines crossing. I am waiting to see if it can cross the zero line to trigger a market movement.
The daily chart is oscillating around the MA20, but for now, it is still consolidating sideways, waiting for direction. The probability of continuing to look bullish is relatively high.
Support: 114700—115700—117000
Resistance: 121000—123300
Ethereum
The monthly MACD for Ethereum shows a bullish divergence. We need to pay attention to the resistance at 4000~4100. If it breaks through, there is a chance to reach 4800 or even 6000. Last week, I mentioned a T-shaped line on the weekly chart, which still signals strength.
The daily chart reached a new high yesterday, and today it is retracing. We need to focus on two support levels: 3700 and 3500. The 4-hour chart is forming an ascending triangle, and I previously predicted that we should mainly watch when Bitcoin can initiate a movement to drive Ethereum.
Support: 3500—3700
Resistance: 4000—4100
If you like my views, please like, comment, and share. Let's navigate through the bull and bear markets together!!!
This article is time-sensitive and for reference only; it is updated in real-time.
Focusing on candlestick technical research, sharing global investment opportunities. Public account: BTC Trading Prince Fusu

免责声明:本文章仅代表作者个人观点,不代表本平台的立场和观点。本文章仅供信息分享,不构成对任何人的任何投资建议。用户与作者之间的任何争议,与本平台无关。如网页中刊载的文章或图片涉及侵权,请提供相关的权利证明和身份证明发送邮件到support@aicoin.com,本平台相关工作人员将会进行核查。


