Written by: hoeem
Translated by: Saoirse, Foresight News
Wealth that is passed down through generations often emerges during the transition from a tightening cycle to a loosening phase. Therefore, understanding your position in the liquidity cycle is key to accurately positioning your assets. Which stage are we currently in? Let me explain in detail…
Why You Must Pay Attention to the Liquidity Cycle (Even If You Dislike Macroeconomics)
Central bank liquidity is like the lubricant for the global economic engine:
Injecting too much can cause the market to "overheat"; withdrawing excessively can lead to "stuck pistons," just like your carefully dressed date suddenly leaving you. The key point is: if you can keep up with the rhythm of liquidity, you can anticipate bubbles and crashes in advance.
Four Stages of Liquidity from 2020 to 2025:
1. Surge Phase (2020-2021)
Central banks were like fire hoses running at full throttle, pouring in water: zero interest rates were established, and the scale of quantitative easing (QE) reached historic records, with $16 trillion in fiscal relief flooding the market.
From the background, the global money supply (M2) grew faster than at any time since World War II.
2. Exhaustion Phase (2021-2022)
Interest rates soared by 500 basis points, quantitative tightening (QT) was initiated, and crisis relief programs expired.
Intuitively, the bond market in 2022 recorded the largest drop in history (approximately -17%).
3. Steady Phase (2022-2024)
Policies remained tight, with no new actions taken.
Decision-makers maintained existing policies to let them fully take effect in suppressing inflation.
4. Initial Turn Phase (2024-2025)
The world began to cut interest rates and loosen restrictions; although rates remained relatively high, a downward trend had begun.
Mid-2025 Status: We still have one foot in the steady phase while tentatively stepping into the initial turn phase. Current interest rates are high, and quantitative tightening continues, but unless a new shock pulls us back into the surge mode, the next step is likely to continue loosening.
More details can be found in the "Traffic Light Quick Reference Manual" below…
That's right, I asked GPT to help create a super cool table! The table below allows you to see the situation in the key years of 2017, 2021, and 2025 at a glance:
Twelve Major Liquidity Lever Traffic Light Quick Reference Manual:
🔴 Not Activated 🟧 Mildly Activated 🟢 Strongly Activated
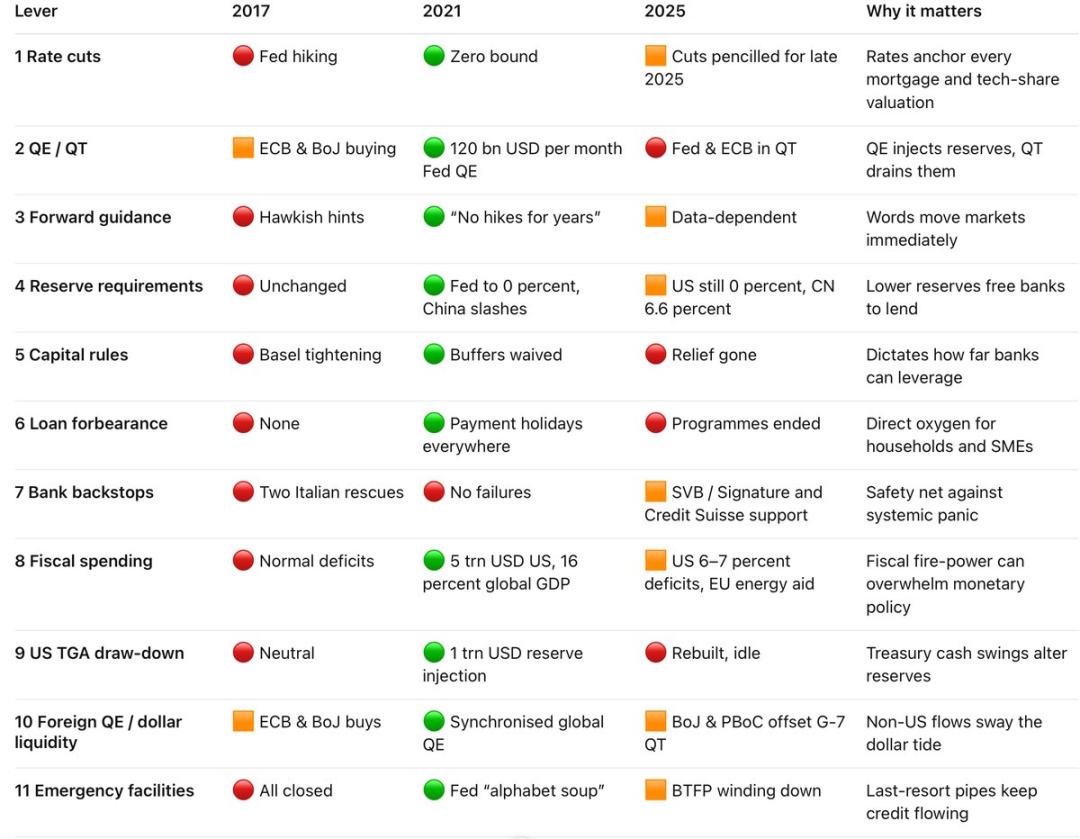
🔑 Which switch can activate the other 11 levers?

Step-by-Step Breakdown:
On Interest Rate Cuts — In 2017, the Federal Reserve raised interest rates, and there was almost no easing policy globally; in 2021, global emergency interest rate cuts brought rates close to zero; by 2025, to maintain credibility against inflation, rates remain high, but the U.S. and core European countries plan to implement slight interest rate cuts for the first time by the end of 2025.
Quantitative Easing / Tightening (QE/QT) — In 2017, the Federal Reserve was reducing its balance sheet while other major central banks were still buying bonds; from 2020 to 2021, record-breaking quantitative easing policies were launched worldwide; by 2025, the policy stance reversed, with the Federal Reserve continuing quantitative tightening, the Bank of Japan still engaging in unlimited bond purchases, and China selectively injecting liquidity.
In simple terms: quantitative easing is like "blood transfusion" for the economy, while quantitative tightening is "slowly drawing blood."
You need to know when we will enter the quantitative tightening or quantitative easing phase, and which position we are currently in the liquidity cycle…
Mid-2025 Status Dashboard:
- On Interest Rate Cuts: Policy rates remain high; if progress goes smoothly, the first interest rate cut may occur in the fourth quarter of 2025.
- Quantitative Easing / Tightening (QE/QT): Quantitative tightening (QT) is still ongoing, and no new quantitative easing (QE) policy has been introduced yet, but early stimulus signals have emerged.
Key Signals to Watch:
Signal 1: Inflation Rate Drops to 2% and Policymakers Announce Risk Balance
- Observation Points: The Federal Reserve or ECB makes a clear statement shifting to neutral language.
- Key Significance: Clears the last public opinion hurdle for interest rate cuts.
Signal 2: Pause in Quantitative Tightening (QT) (Cap Set at 0 or 100% Reinvestment)
- Observation Points: The Federal Open Market Committee (FOMC) or ECB announces full reinvestment of maturing bonds.
- Key Significance: Transitions the balance sheet reduction to a neutral state, increasing market liquidity reserves.
Signal 3: Three-Month Forward Rate Agreement and Overnight Index Swap Spread (FRA-OIS) Exceeds 25 Basis Points or Repo Rates Suddenly Surge
- Observation Points: The three-month FRA-OIS spread (Note: The difference between the forward rate agreement (FRA) rate and the overnight index swap (OIS) rate is an important indicator of financial market credit risk and liquidity risk.) or general collateral (GC) repo rates jump to around 25 basis points.
- Key Significance: Indicates dollar financing pressure, which usually forces central banks to provide liquidity support.
Signal 4: The People's Bank of China (PBoC) Fully Lowers the Reserve Requirement Ratio (RRR) by 25 Basis Points
- Observation Points: The national reserve requirement ratio drops below 6.35%.
- Key Significance: Injects 400 billion yuan of base currency, often becoming the first domino in emerging market easing policies.
In Summary…
We are not yet in the surge phase.
Therefore, before a large number of levers turn green, the market will continue to experience fluctuations in risk appetite and will not truly enter a frenzy phase.
免责声明:本文章仅代表作者个人观点,不代表本平台的立场和观点。本文章仅供信息分享,不构成对任何人的任何投资建议。用户与作者之间的任何争议,与本平台无关。如网页中刊载的文章或图片涉及侵权,请提供相关的权利证明和身份证明发送邮件到support@aicoin.com,本平台相关工作人员将会进行核查。


