人生如线,只要今天还在延续,只要明天还有希望,我们就永远在起点上,永远在奔跑的路上。不要惧怕路长,不要抱怨路边没有风景,任何时候都不要绝望,只要不停地跑,哪些脚下的坎坷,原来都是垫高我们人生的基石,或许转机就在下一个转角!
昨天没更新文章,主要是在昨天白天确实没什么行情,当时一直处于小区域的震荡之中,也就没啥可更新,但在晚间开始,这个行情就开始了一发不可收拾,在晚间9点的时候开始给到一个109750高点,随后马上回调,然后在凌晨开始,强势拉升开始,一路直到新高。操作上,怎么说呢,大家应该也能看出来纵横最近这几天的操作思路,一直在强调的是107000未破的情况下,就是看震荡上涨的行情,这是近期的一个看多基础,另外昨天安排做空是在109500,首次给到进场机会,后面也回调给到利润,而关键点,我们所强调“右侧交易”,是行情突破110000,就是给到右侧交易的机会。但我们在实际操作上来,还是有一些问题,昨天做空若没有在回调中出局的话,在后面的拉升行情之中,是肯定要被扫损了,而拉升行情出现在凌晨,没有挂单的情况下,基本上是来不及进行右侧交易来追多的,当然如果一直将多单持有到高点是赚到最多的,肯定也有,对于我个人是没能做上多单的,睡觉前的行情还未能形成突破,然后就是比特币在美股上涨的带动下,偷摸的到了历史新高。
今天的行情,我觉得应该还是值得关注的,先是从流动性清算强度上看,这一波拉升将前期大部分的空头流动性给完成了清算,目前短期内的主要清算强度空头流动性主要位于113000附近位置,而多头流动性强度则是大量堆积在108000附近,并且流动性要高于空头,可能是在比特币突破新高之后,在目前的小幅回调中,市场给了多头信心更强,认为新高之后的比特币还会有更高的位置出现。而对于空头呢,也是有点意思,在行情已经突破新高的前提下,还是不断有新的空头流动性在聚集,看来不服输的空头也有很多,这样的情况下,如果接下来继续震荡一下,是不是会吸引到更多的空头加入进来,从而再次给到市场清算空头的机会呢,起码目前所能看到的是还真有这个可能。而且有意思的是,这次新高对比前面,就仅仅只是高出了100多点,好像并不符合强势多头行情的走法,按照形态结构来讲,也是符合双顶构造及流动性抓取行为的,因此之后如果出现了画门回调的行情,那多头就该难受了。
技术面的话,大周期上受到此次拉升的影响并改变结构的影响很小,单纯的日线给到了强势拉升,但反映到实际上的量能并不大,而且现货溢价方面也没有大幅上涨,说明市场现货方面的买入力量并不符合突破历史新高的强烈买入情绪,唯一对这里有些担心的是,这个小破新高的行情形成一个破顶翻的反转行情,并且在技术指标上,MACD量柱走的平缓,很容易就是出现回调进入到空头调整周期,而RSI也是在一个相对高位,不过距离进入超买可能还有一段距离,如果在算上周线大级别的缓冲区域的话,那么后续如果再有多头拉升行情,可能考虑到进入超买之后,我将做主要空头趋势布局了。
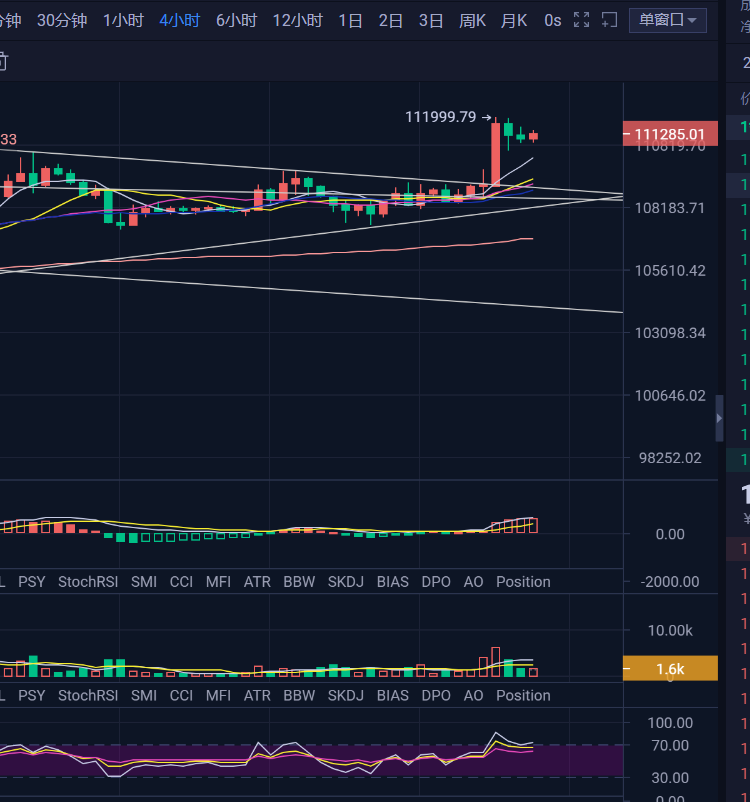
四小时拉高之后,有一定的回落,但这个小幅的回调也未能形成技术指标的修复,一般在行情短时间内出现大波动之后的短期行情是最难受的,给到的短线操作计划参考不大,技术指标上,MACD运行在多头周期高位,RSI也是高位,短期内应该会有一个回调修复过程,从结构上看,前期高点109700附近在强势拉升之后,形成顶底转换,成为当前下方一个关键支撑位置,若行情给到回踩支撑确认的话,可以再来期待一下后续的行情。
操作上,这个位置还是想要短空一下,只是以超短线来操作一下,现价111300附近轻仓短空即可,以高点为防守,若行情形成突破,那么等待完成上方空头清算之后再来布局做空,大概位置112500上方,回落的话,那么109700附近回踩给到来接多,以109000为防守,然后根据后续走势来进行调整。
以太似乎正在兑现我们前面所一直强调的行情走势预期,大饼突破新高,以太随后开启独立行情,也就是“末日战车”式的行情可能性更大了,需要看看接下来几天以太的行情,是否开始真正独立起来,所以对于以太,现阶段就是主要走势小回调,短期内以多为主,然后等待机会做布局大回调了,操作的话,回落给到2720附近,可以接多参与。
【以上分析及策略仅供参考,风险请自担,文章审核发布以及行情实时变化,信息滞后策略不具备及时性,具体操作以实时策略为准,欢迎各位进行联系交流行情】

免责声明:本文章仅代表作者个人观点,不代表本平台的立场和观点。本文章仅供信息分享,不构成对任何人的任何投资建议。用户与作者之间的任何争议,与本平台无关。如网页中刊载的文章或图片涉及侵权,请提供相关的权利证明和身份证明发送邮件到support@aicoin.com,本平台相关工作人员将会进行核查。


