
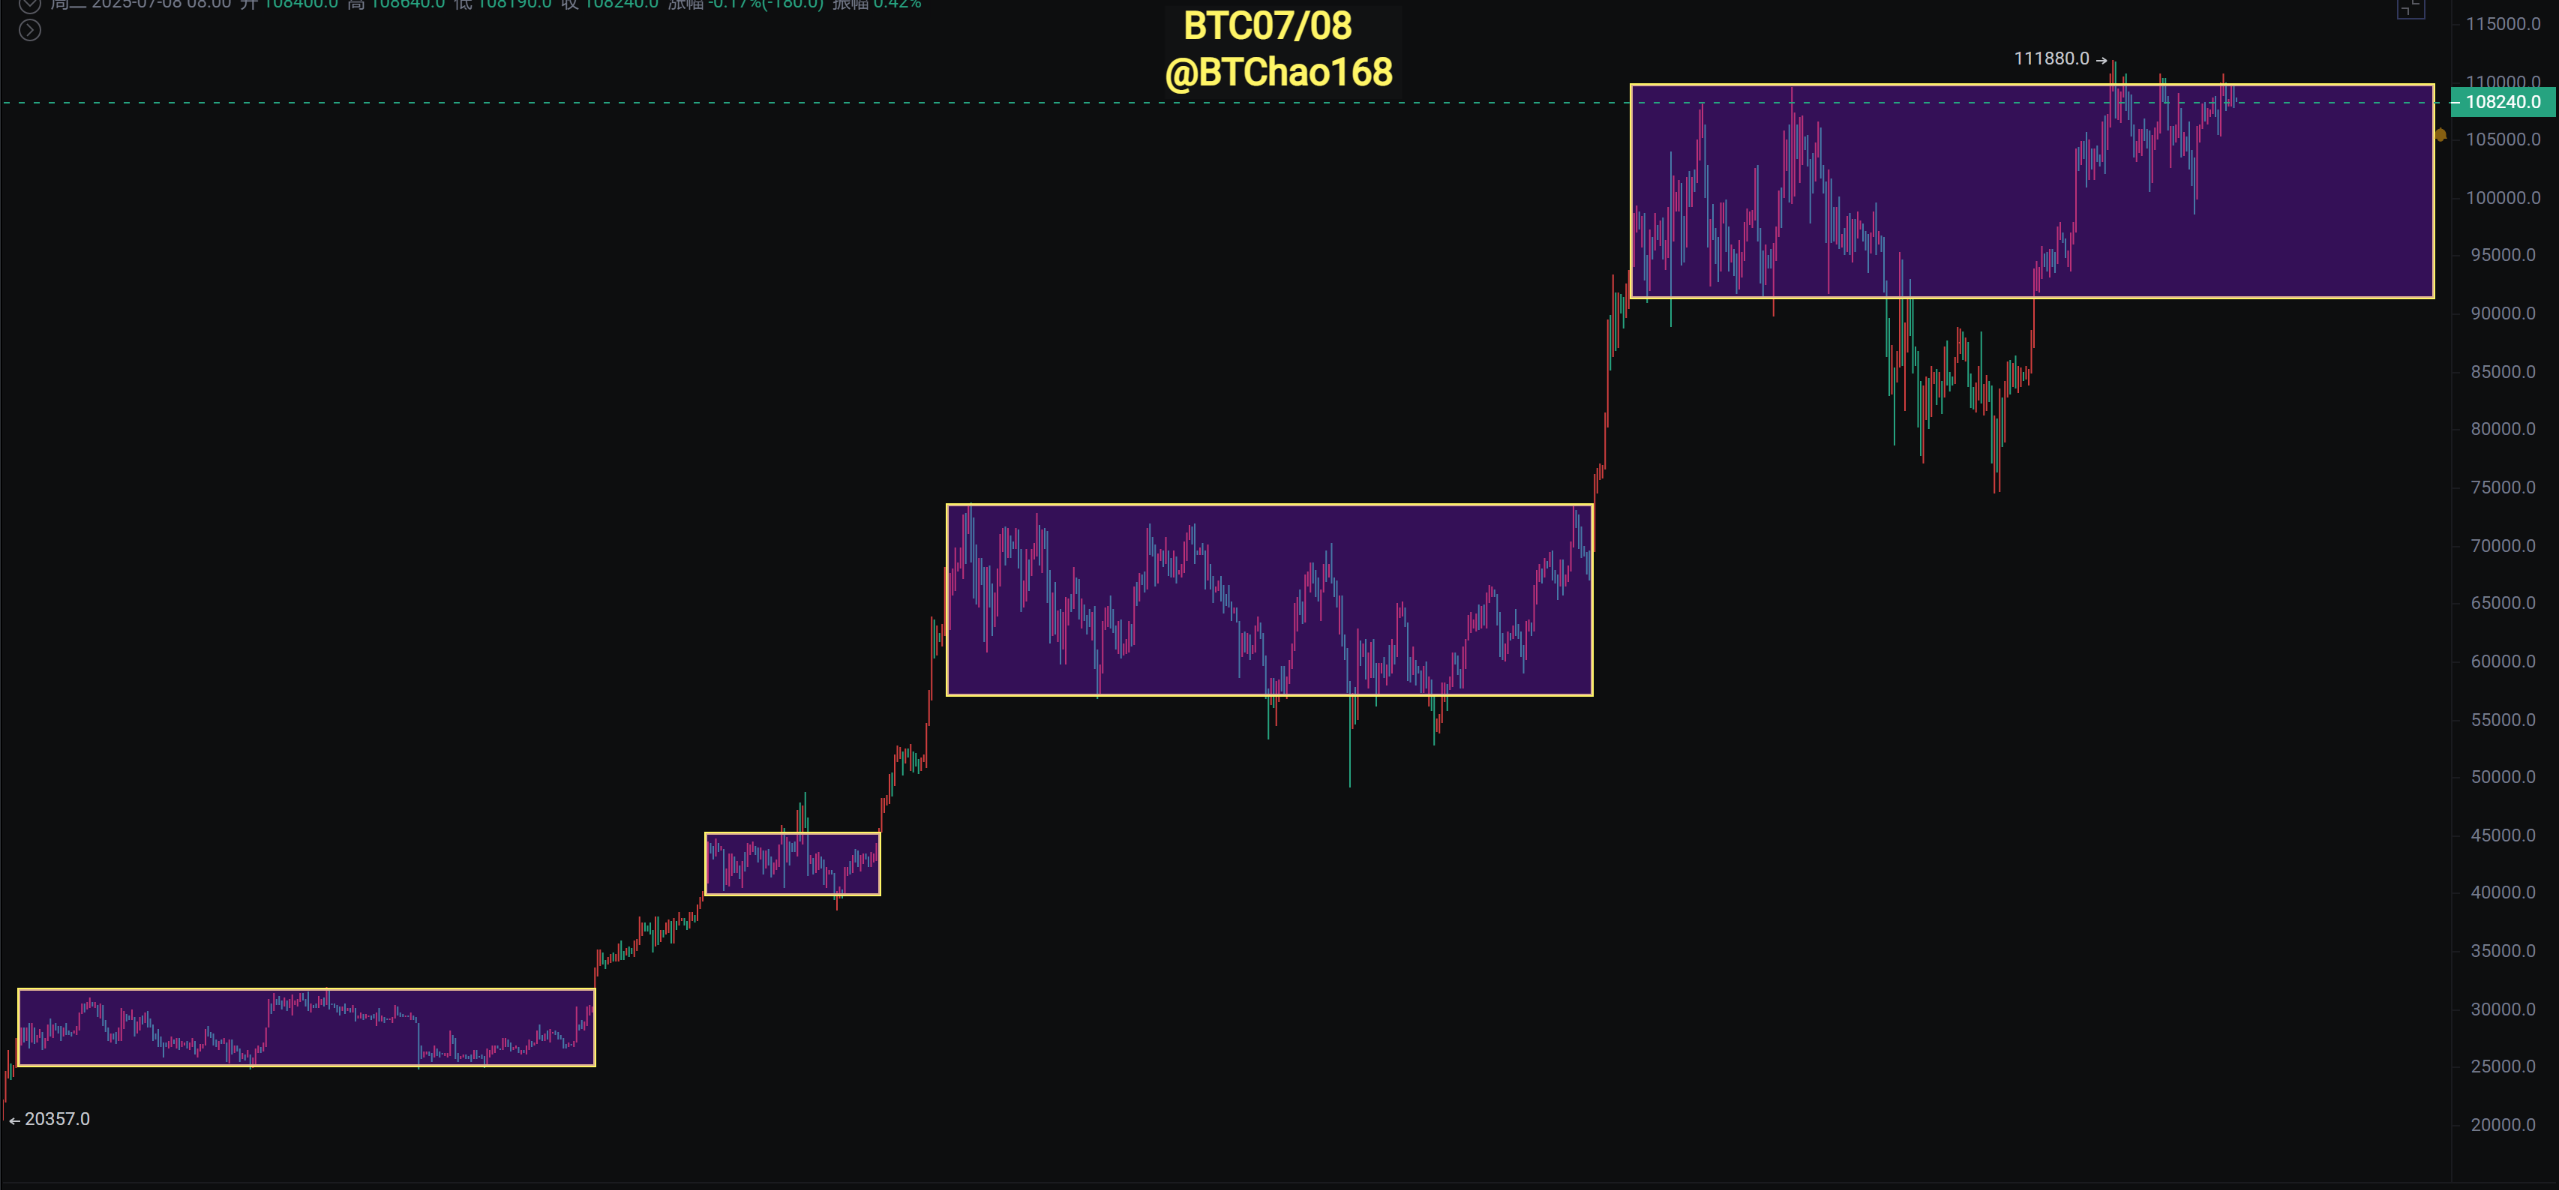
BTC波动率降至2023年以来的最低水平,历史上仅出现过7次,每次达到这些水平,波动率都会在五周内大幅飙升,通常更快。最近的行情可谓是牵动万千交易者的心,食之无味弃之可惜毕竟来到了前高附近,触及最高110500距离前高只有1500点左右之后又回调107000附近得到支撑。
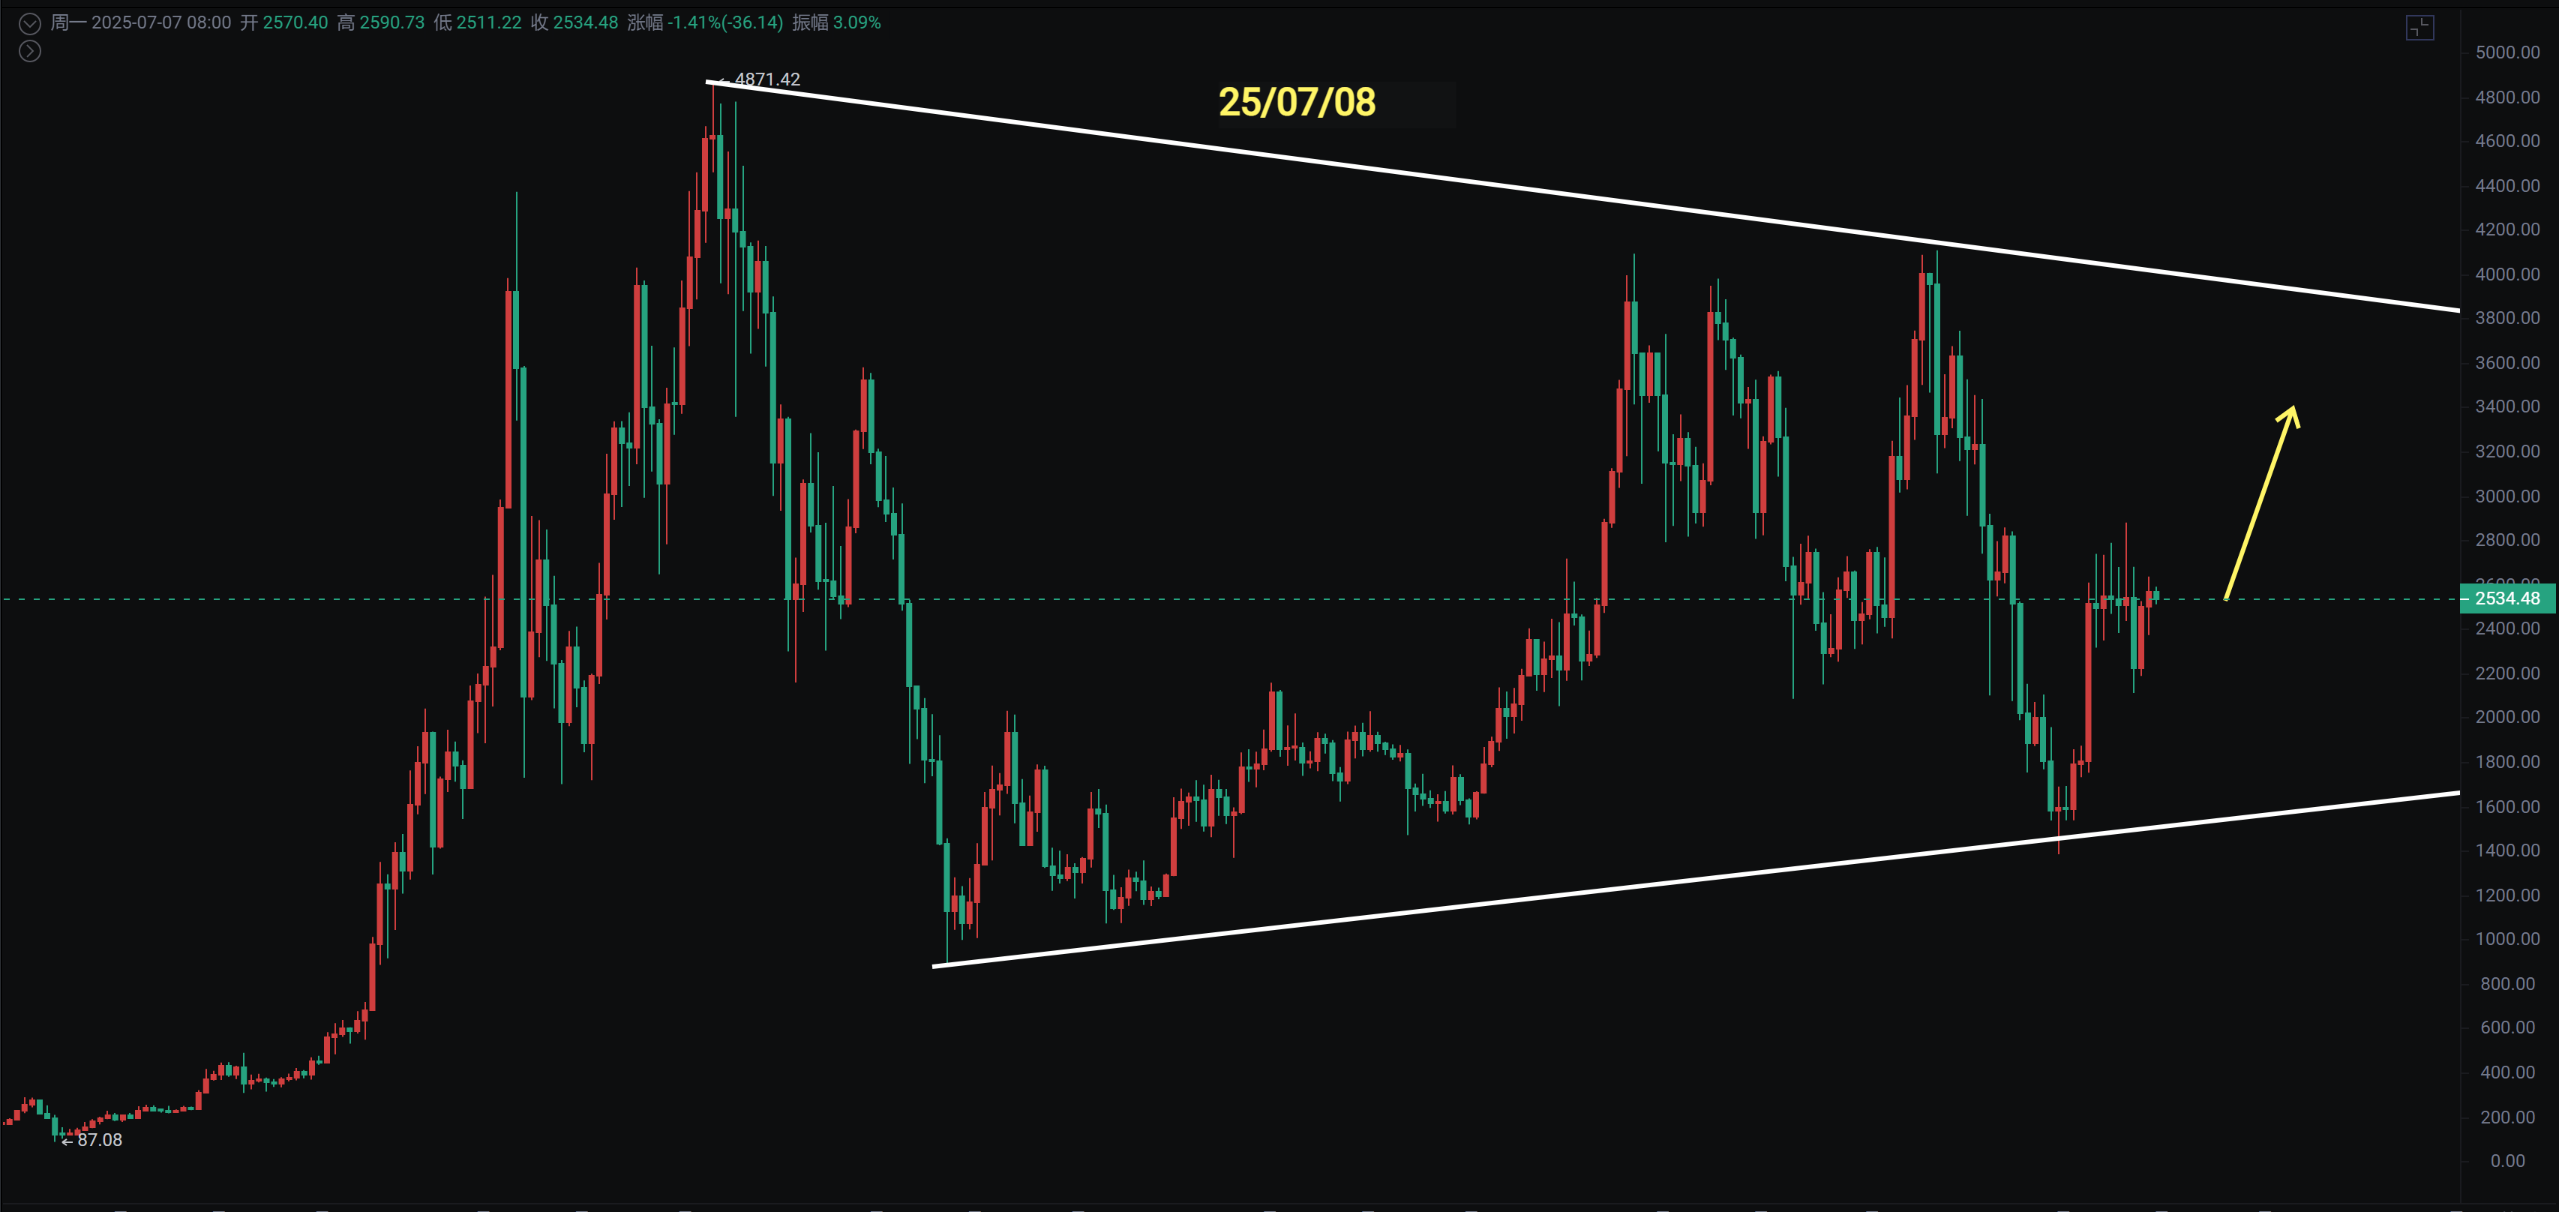
以太重新回到2300上方做箱体震荡,周线回踩BOLL中轨布林带缩口。如果大饼在这里磨很久的情况,以太不排除还要磨一段时间。值得注意的是以太最近几年底部震荡2一3个月后向上飙涨的情况屡见不鲜(下期视频重点分析一下)
大饼
✅ 旗形突破已确认
✅ 结构回测保持稳定
✅ 第3️⃣浪后动能正在建立
✅ 宏观上升趋势完好 这一走势可能会迅速加速,牛市下一个阶段正在展开。
日线上升旗型结构突破回踩目前也是在旗形上沿附近震荡,日线只要维持在MA20和MA60上方就仍然还有机会去突破,目前走的旗形回踩这里和去年旗形突破回踩有异曲同工之处。
日线如果从74500到112000视为第一浪,旗形为第二浪突破前高则视为第三浪,一旦突破前高等比将至135000。
目前在考验107000的支撑下方关键的在105000也就是MA20和60附近支撑,这里跌破才会考虑上升旗形内部继续震荡,那整个的调整周期就和去年基本吻合,9月10月仍然是看好的。
支撑:105000一107000
压力:109000一112000
以太
以太没有太多好说,基本上还是跟着大饼的走势,但是值得留意的是以太在过去两年中经常在底部震荡两三个月之后走单边行情,而且日线站上了三均线上方,所以首先还是看大饼能否有效的突破以太跟随迎来补涨行情,在2300至2700之间已经震荡了70多天,这个区域的支撑还是比较强,就算短期会有回落,但是中长线看还是继续看涨。
支撑:2300—2400
压力:2700一2800
如果你喜欢我的观点,请点赞评论分享,我们一起穿越牛熊!!!
文章具有时效性,仅供参考实时更新
专注k线技术研究,共赢全球投资机会公众号:BTC交易公子扶苏

免责声明:本文章仅代表作者个人观点,不代表本平台的立场和观点。本文章仅供信息分享,不构成对任何人的任何投资建议。用户与作者之间的任何争议,与本平台无关。如网页中刊载的文章或图片涉及侵权,请提供相关的权利证明和身份证明发送邮件到support@aicoin.com,本平台相关工作人员将会进行核查。


