周末凌晨随着美国亲自下场携带轰炸机,轰炸伊朗核设施。币圈再次承受消息面带来的加速下跌,截止到周末晚间22:00 比特币日内跌幅2.66% 以太坊则暴跌接近9%的幅度。
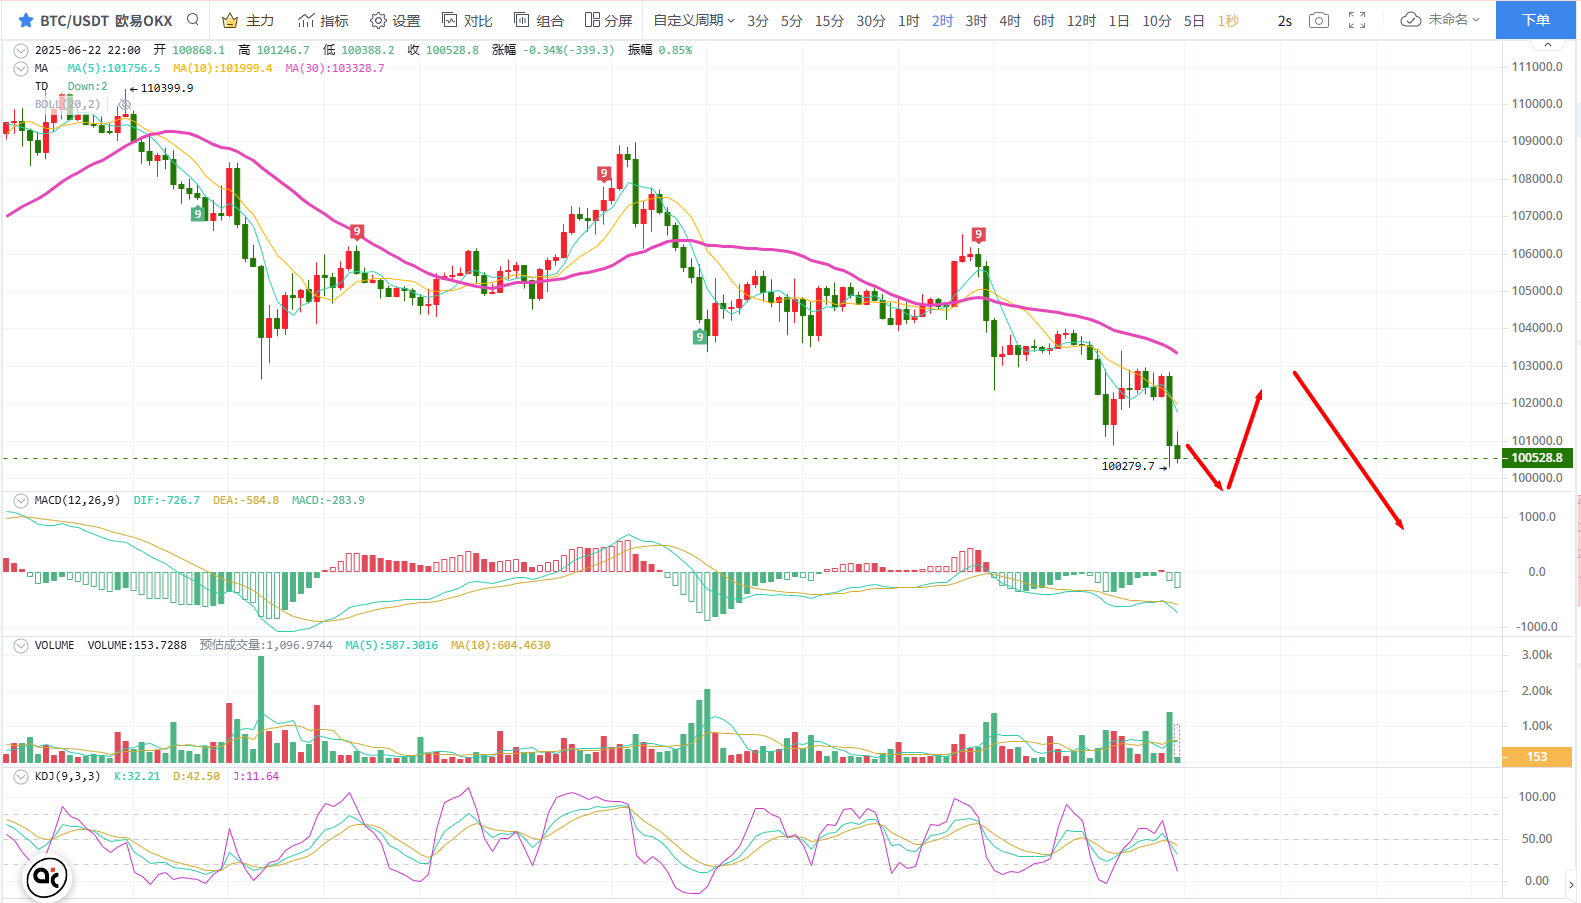
目前日线级别柱再次走出TD6下跌走势,K 柱4连阴。MA5 10 日均线和BOLL带中轨开始小幅共振下压币价,MACD与KDJ 呈空头放量下跌排列,说明大方向空头占据主导地位。当然日线级别强压参考在:102500-103300一线。币价反抽无法有效站稳上方任意压制,保持高空看待即可。 短期低点支撑参考在:100200一线 一旦空头放量跌破此支撑那么,明天周K 更新比特币回落到96000一线前期起涨点,也是时间问题。
4小时随着晚间空头发力,当前MA5 10日均线共振下压币价,TD指标再次走出绿色TD1下跌走势,个指标来看当前空头情绪浓厚,结合小时线来看当前比特币整体走势短期空头主导趋势,所以对于凌晨到早间操作而言个人看法高空为主,低多为辅思路。
操作思路:102000-103000分批轻仓箜 目标:100500-99000 即可 向下插针看至97000 止笋:103500
低哆可轻仓尝试 :点位参考在:99000-99500一线 目标:101500-102500即可
以太坊目前整体走势于大饼同步,由于日线走势领先比特币 。短期行情也是偏向震荡下跌走势。不过由于成交量和抗跌性不如大饼造成跌幅巨大,其高点压制参考在:2265-2300一线。币价反抽无法有效站稳上方任意压制,保持高空看待即可 低点支撑参考在:2130-2000一线, 所以对于凌晨到早间操作而言个人看法高空为主,低多为辅思路。
操作思路:2265-2300空 目标:2180-2130即可 插针看至2000 止笋:2330
低哆可轻仓尝试 :点位参考在:2150-2110 目标:2250-2280即可
对于短期走势而言预计够用,后续将会继续更新
个人看法仅供参考,文章审核推送有延迟,行情瞬息万变,具体进场离场点位以实时指导为主,入市需谨慎 分析不易欢迎大家点赞 关注公众号有惊喜!

免责声明:本文章仅代表作者个人观点,不代表本平台的立场和观点。本文章仅供信息分享,不构成对任何人的任何投资建议。用户与作者之间的任何争议,与本平台无关。如网页中刊载的文章或图片涉及侵权,请提供相关的权利证明和身份证明发送邮件到support@aicoin.com,本平台相关工作人员将会进行核查。


