原文标题:《沉默的买家:ETF 与链上巨鲸如何重写 BTC 的供需法则?|WTR 6.16》
原文来源:WTR 研究院
本周回顾
本周从 6⽉9⽇到 6⽉16⽇,冰糖橙最⾼附近$110530,最低接近$102664,震荡幅度达到 7.12% 左右。观察筹码分布图,在约 103876 附近有⼤量筹码成交,将有⼀定的⽀撑或压⼒。
• 分析:
1. 60000-68000 约 120 万枚;
2. 76000-89000 约 124 万枚;
3. 90000-100000 约 140 万枚;
• 短期内跌不破在 95000~100000 概率为 80%;
重要消息⽅⾯
经济消息⽅⾯
市场开盘表现:
• 周⼀美股指开盘,纳斯达克指数盘中涨幅 1.6%,标普 500 指数涨幅 1.06%。
• ⻩⾦跌幅 1%,布油跌幅 2%,美元指数跌幅 0.17%。
美联储(FOMC)动态与降息预期:
• 本周四 02:00,美联储 FOMC 将公布利率决议和经济预期摘要。
• 由于近期公布的 CPI(消费者物价指数)和 PPI(⽣产者物价指数)数据弱于预期,市场已提前了对下⼀次降息时间的预期,认为在 9⽉份降息的概率较⼤。
• 市场关注焦点在于美联储是否会释放关于未来降息时机的明确信号。
• 花旗分析师指出,当前市场可能低估了降息的可能性。
• 杰富瑞经济学家 Mohit Kumar 表⽰,美联储主席鲍威尔可能会强调经济增⻓和通胀前景存在不确定性,基调可能是不急于降息,但会做好在经济有需要时做出回应的准备。
• 市场普遍预计美联储主席鲍威尔将维持中性态度。
地缘政治与市场影响:
• 在美联储议息会议前,市场关注点之⼀是以⾊列与伊朗的冲突。
• 中东局势的持续紧张以及地缘冲突的担忧对⻛险资产构成压⼒。
机构预测:
• ⾼盛(Goldman Sachs)维持其预测,认为⻩⾦价格将在 2025 年底达到 3700 美元/盎司,并在 2026 年中期达到 4000 美元/盎司。加密⽣态消息⽅⾯
⾹港稳定币监管进展:
• ⾹港财政司司⻓陈茂波表⽰,随着数字资产市场发展,对稳定币的需求将增加。
•《稳定币条例》已获⽴法会通过,将于 8⽉1⽇⽣效。
• 条例⽣效后,⾹港⾦管局将尽快处理收到的牌照申请,旨在吸引全球机构在⾹港根据实际应⽤场景发⾏稳定币,以提⾼市场流动性和竞争⼒。
• 去年⾹港本地银⾏的数字资产及相关产品交易总额达 172 亿港元,年底在银⾏托管的数字资产总额达 51 亿港元。
加密货币市场表现与分析:
• Circle(USDC 发⾏商)盘中涨幅 20%,市值升⾄350 亿美元。
• BTC 涨幅 2.2%,ETH 涨幅 3.6%。
• QCP 分析:尽管中东局势紧张,但 BTC 未出现恐慌性下跌,显⽰市场韧性改善,机构持续增持成为关键⽀撑。
• 10x Research 分析:在油价上涨、美债收益率坚挺、数据分化及美联储谨慎的背景下,BTC 的宏观基本⾯正悄然转强。盘整时间越⻓,未来突破的可能性越⼤。
• 夏季的季节性因素或令 BTC 短期继续整理,但中⻓期的宏观信号转向,为年内潜在上涨奠定基础。
• BTC 周期表现:本轮周期表现与过去相似,2015-2018 年涨幅 1076%,2018-2022 年涨幅 1007%,2022 年⾄今涨幅 656%。
ETF 资⾦流向:
• 上周美国 BTC 现货 ETF 总流⼊13.7 亿美元,其中⻉莱德(BlackRock)的 IBIT 流⼊11.159 亿美元。
• 上周美国 ETH 现货 ETF 流⼊5.282 亿美元。
• 现货 BTC ETF 已连续第七周录得净流⼊。
• CoinShares 数据:数字资产连续第九周实现净流⼊,上周流⼊19 亿美元,本轮连续流⼊总额达 129 亿美元,年初⾄今的总流⼊额创下新⾼⾄132 亿美元。
• 彭博 ETF 分析师 Eric Balchunas 称,⻉莱德的 BTC 现货 ETF 持仓规模已突破 700 亿美元,仅⽤341 天就成为最快达到此⾥程碑的 ETF。
企业持仓与链上数据:
• 美股上市公司 SharpLink Gaming 斥资 4.63 亿美元增持 176,271 ETH,成为持有 ETH 最多的上市公司。
• ⽇本上市公司 Metaplanet 增持 1112 BTC,总持仓量达到 1 万 BTC。
• Santiment 数据:当前共有 6392 个地址持有 1000⾄10 万 ETH,过去 30 天这些地址共增持 149 万 ETH,增⻓了 3.72%。
市场预测与未来催化剂:
• Cointelegraph 报道:市场共识并⾮看空,⽜市未结束,市场认为 BTC 正准备进⼊新⼀轮的价格发现阶段,预计价格将达到 17 万美元,⽽11.3 万美元是唯⼀的阻碍。
• VanEck 数字资产主管 Matthew Sigel 表⽰:低市值上市公司扬⾔建⽴⼤规模加密储备可视为骗局,很可能只是为了抬⾼公司股价。
• 潜在催化剂:夏季末可能出现的美联储降息以及美国的《GENIUS 稳定币法案》可能成为刺激⾏情反转的契机。
美国监管动态:
• 美国证券交易委员会(SEC)宣布了四项⾼级⼈事任命,其中包括两名具有数字资产经验的成员,这被解读为释放出 SEC 主管 Paul Atkins 对加密⾏业更为友好的信号。
稳定币市场数据:
• 稳定币总市值在过去 7 天增⻓0.63%,达到 2515.42 亿美元。
⻓期洞察:⽤于观察我们⻓期境遇;⽜市/熊市/结构性改变/中性状态
中期探查:⽤于分析我们⽬前处于什么阶段,在此阶段会持续多久,会⾯临什么情况
短期观测:⽤于分析短期市场状况;以及出现⼀些⽅向和在某前提下发⽣某种事件的可能性
⻓期洞察
• ⾮流动的⻓期巨鲸
• 现货总抛压
• ETF 的储备状况
• 半年以上的⻓期投资者
• 交易平台的⼤额净转账
• 短期投机者成本线
第⼀部分:核⼼链上数据逐⼀解析
(下图 ⾮流动的⻓期巨鲸)
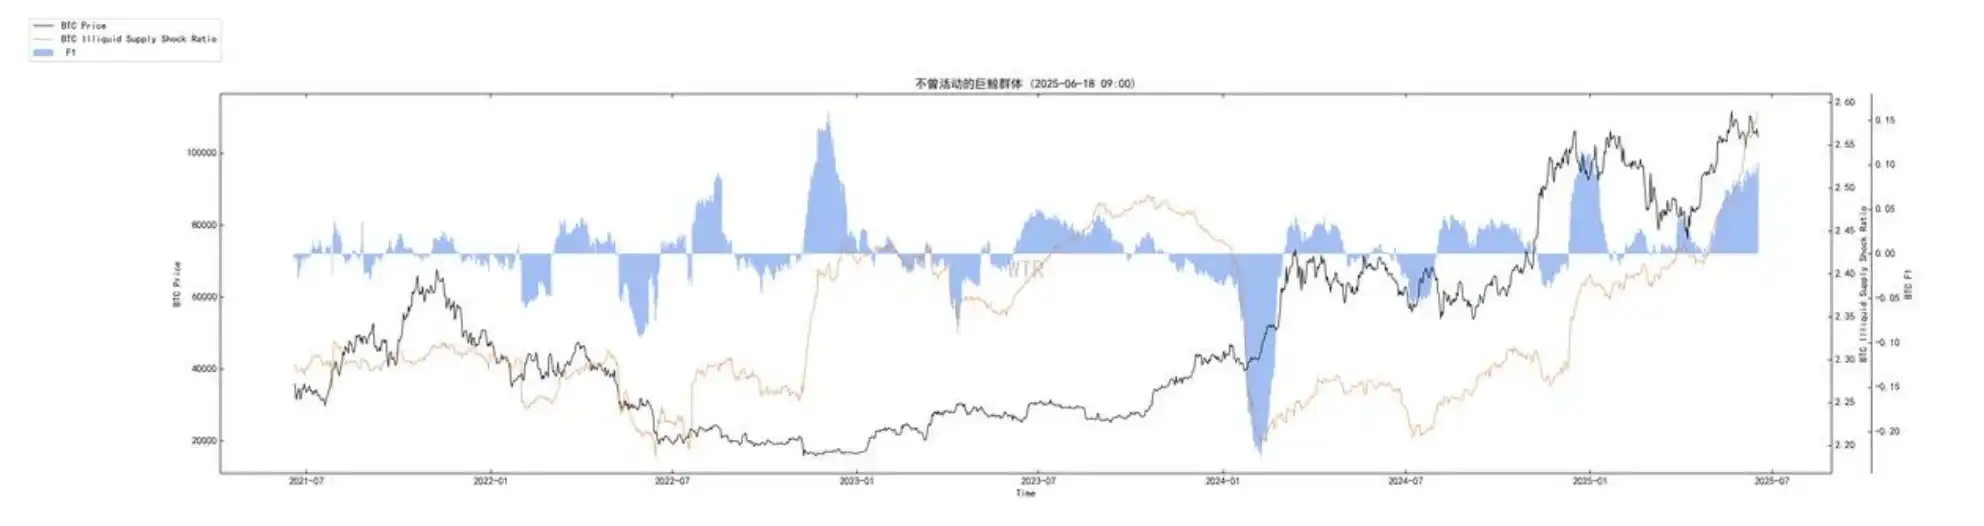
这些市场中最具⻓远眼光和资⾦实⼒的参与者,正处在⼀个持续且斜率陡峭的积累周期中。这并⾮短期⾏为,⽽是⼀种⻓期的、战略性的资产配置。它表明,最有影响⼒的资本正在利⽤当前阶段,系统性地增加其核⼼持仓。
(下图 现货总抛压)
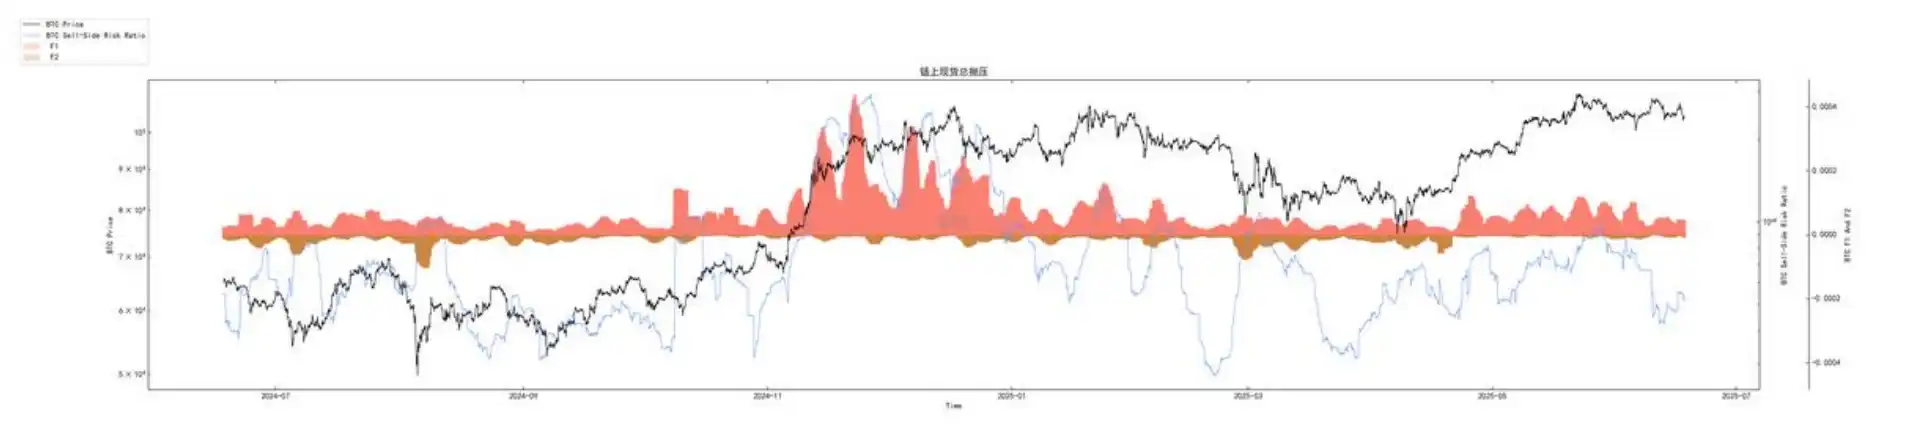
当前市场的整体抛售意愿处在近期低位。这意味着⽆论价格如何波动,持有者群体⸺⽆论是盈利还是亏损的⸺都表现出了相当的「惜售」⼼态。急于卖出的⼒量很弱,这为市场提供了⼀个稳固的底层环境。
(下图 ETF 的储备状况)
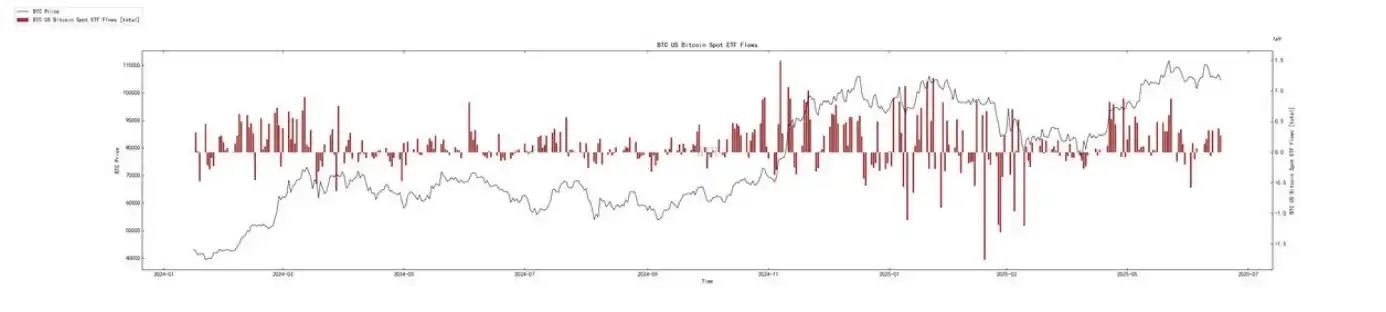
ETF 的资⾦流动已经从早期的「爆发式」涌⼊,过渡到了⼀个更成熟、更平稳的「配置式」净流⼊阶段。虽然单⽇流⼊额度减⼩,但关键在于资⾦流向并未逆转,依然维持着整体的净流⼊或平衡。这代表着⼀股来⾃主流⾦融世界的、持续不断的背景购买⼒。
(下图 半年以上的⻓期投资者)
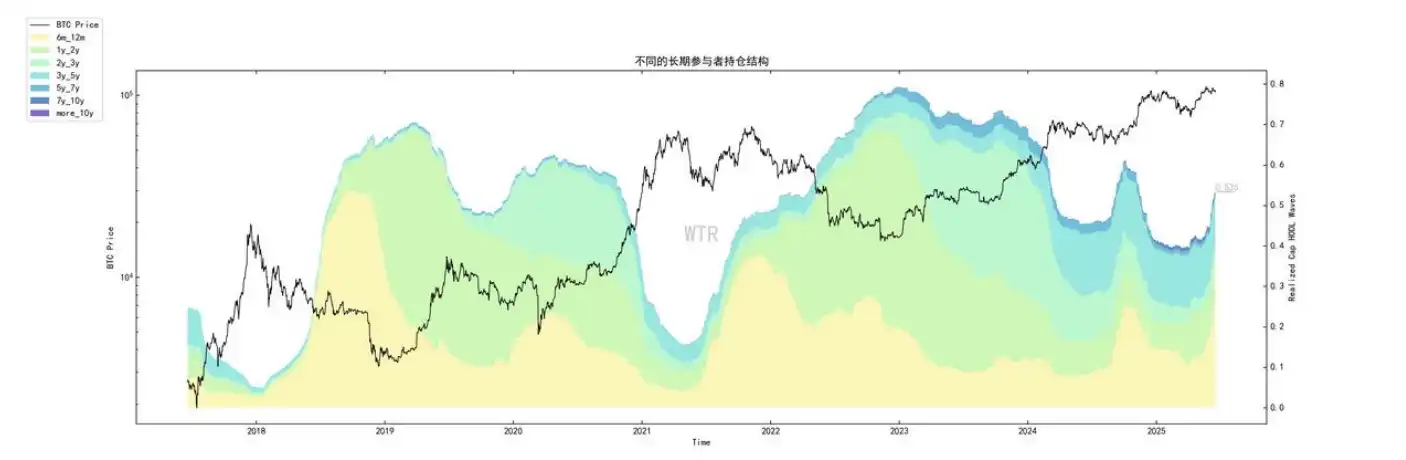
这是最宏观、最结构性的⼀个指标。超过 53.5% 的供应量已被⻓期持有者锁定,这⼀数字仍在快速上升。这从根本上改变了市场的供应结构,⼤量代币退出了短期流通市场,进⼊了「准库存」状态,使得可供交易的有效供应量持续减少。
(下图 交易平台的⼤额净转账)
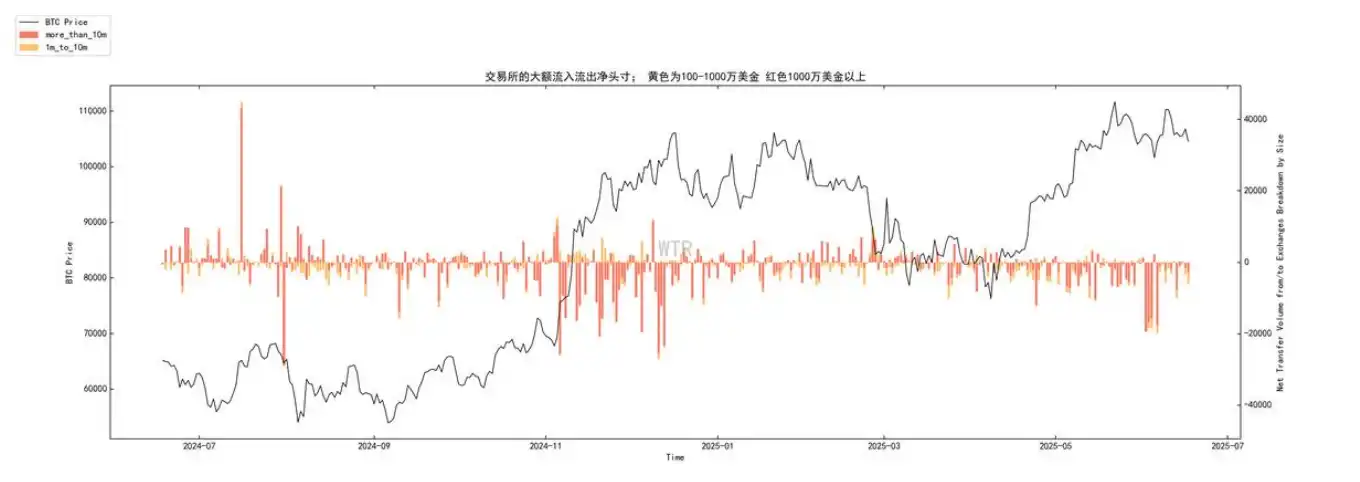
近期显⽰,⼤额转账以净流出为主。这是⼀个明确的信号,表明⼤型投资者在购买后,倾向于将资产从交易平台提⾛,移⼊私⼈钱包。这种⾏为的动机是⻓期储藏,⽽⾮短期交易,它直接导致了交易平台内可供出售的现货库存减少。
(下图 短期投机者成本线)
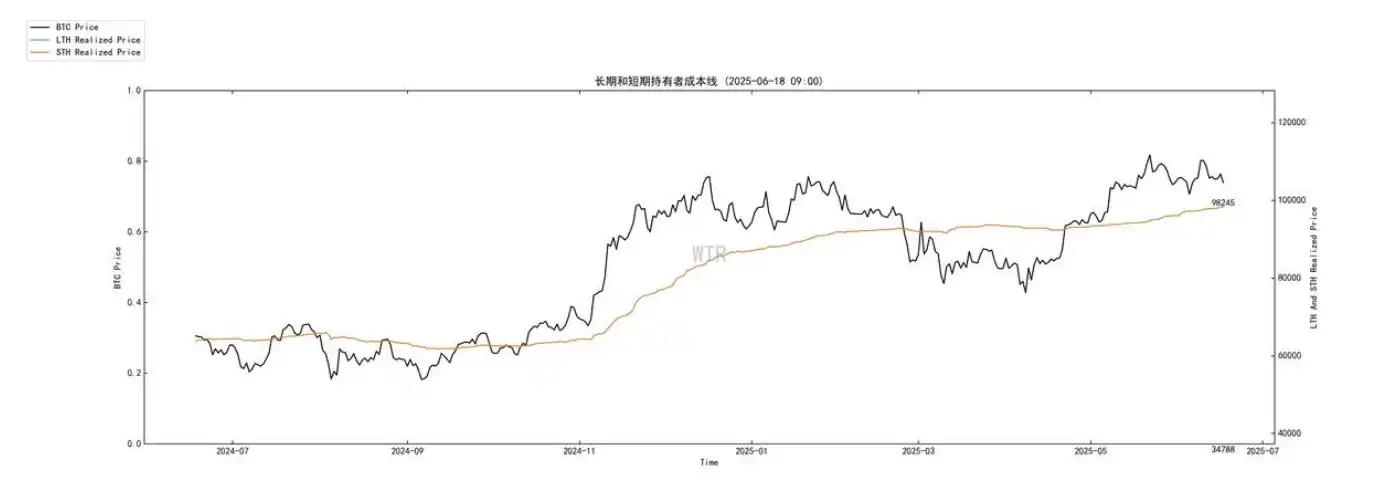
1. 位于 98,245 美元的成本线,是近期市场活跃资⾦的⼼理盈亏分界线。它是短期市场情绪的「⻢奇诺防线」,价格在其上运⾏,则市场相对安全;若被跌破,则可能触发短期交易者的⽌损⾏为。
第⼆部分:深度整合分析
市场的表⾯,是宏观不确定性与微观数据强势之间的⼀场对峙。交易者们紧盯着美联储的动向,似乎市场的命运完全悬于⼀线。价格的窄幅波动,加剧了这种「暴⻛⾬前」的紧张⽓氛。但,如果退后⼀步,就会发现⼀个深刻的⽭盾:如果宏观的寒⽓如此逼⼈,为何市场内部的各项「⽣理指标」却显得如此健康有⼒?⻓期持有者在增加,巨鲸在积累,抛压在降低。
表明,市场的内在肌体正在发⽣某些深刻的变化,使其对外部的「天⽓」产⽣了更强的抵抗⼒。真正的故事,或许并⾮关于天⽓,⽽是关于肌体本⾝。为了理解这种内在变化,可以借⽤「地质板块」的⽐喻,并此次将所有数据融⼊其中。加密资产市场这⽚⼤陆,其「地质构成」正在发⽣根本性的改变。这场「地质运动」的核⼼驱动⼒,来⾃于「⻓期投资者」的持续增加,他们是总⼯程师。超过⼀半的版图,已经从松软的、易受侵蚀的「流沙」,变成了坚硬的「基岩」。能清晰地看到这场⼯程细节:
•「⾮流动⻓期巨鲸」和「ETF」是两⽀最主要的施⼯队。前者如同板块内⽣的构造⼒,从内部挤压、固化⼟地;后者则像是外部的填海⼯程,不断为这⽚⼤陆带来新的、稳定的物质。
•「交易平台⼤额净流出」则是施⼯⽇志,记录了「基岩」材料(代币)被从流动的「市场海洋」中捞起,并被牢牢固定到⼤陆板块上的过程。
• 这场地质运动的结果,是⼤陆的稳固性⼤⼤增强。「现货总抛压」的降低就如同⽓象站的报告,显⽰即使有⻛暴(宏观利空),也很难再像过去⼀样卷起漫天沙尘,因为⼤部分沙⼦都已变成了岩⽯。
⽽在这⽚⽇益坚实的基岩⼤陆上,还覆盖着⼀层薄薄的、流动的表⼟。这层表⼟的「平均海拔」,就是「短期投机者」的成本线:98,245 美元。宏观的「潮汐」⸺即美联储的货币政策⸺主要就在这层表⼟上发挥作⽤,冲刷出⽇常的价格波动。⾄此,便能看清全貌。市场的表层张⼒,是宏观潮汐在冲刷⼀块⽇益坚固和扩⼤的⼤陆时所产⽣的正常现象。⼈们之所以感到紧张,是因为他们将⽬光过度聚焦于潮汐的涨落,⽽忽略了脚下⼤陆本⾝那更为深刻、更为持久的隆起。这并⾮⼀场脆弱的拔河,⽽是周期性的⾃然现象(宏观周期)与结构性的地质演化(所有权转移)之间的相互作⽤。
市场的反应模式因此发⽣了改变:它对负⾯潮汐(宏观利空)的侵蚀有了更强的抵抗⼒,因为⼤部分⼟地已是基岩;⽽对正⾯潮汐(宏观利好),则可能因为河道(流动性)的收窄⽽产⽣更⾼、更迅猛的浪花。
第三部分:展望
短期展望:
短期内,焦点仍在「潮汐」。美联储的决策是最⼤的变量,将直接决定潮⽔的⾼度,从⽽引发价格波动。98,245 美元的「海岸线」将是关键的观测点,市场会反复测试这⼀⽔平。任何宏观逆⻛都可能导致价格暂时跌破此线,但这更应被视为⼀次观察「基岩」⽀撑强度的机会。
中⻓期展望:
中⻓期的核⼼,是「地质运动」本⾝。我们需要持续度量基岩增厚的速度⸺即⻓期投资者占⽐、ETF 流⼊的可持续性、巨鲸积累的动态。只要这场运动在继续,⼤陆的版图就在扩张,市场的价值根基就在加深。当下⼀个宏观顺⻛的「⼤潮」来临时,它所托举起的,将是⼀个远⽐过去更加庞⼤和稳固的价值实体。
中期探查
• 流动性供应量
• 巨鲸购买⼒综合得分
• BTC 交易平台趋势净头⼨
• 增量模型
• 全球购买⼒
• 链上总筹码分布结构
(下图 流动性供应量)
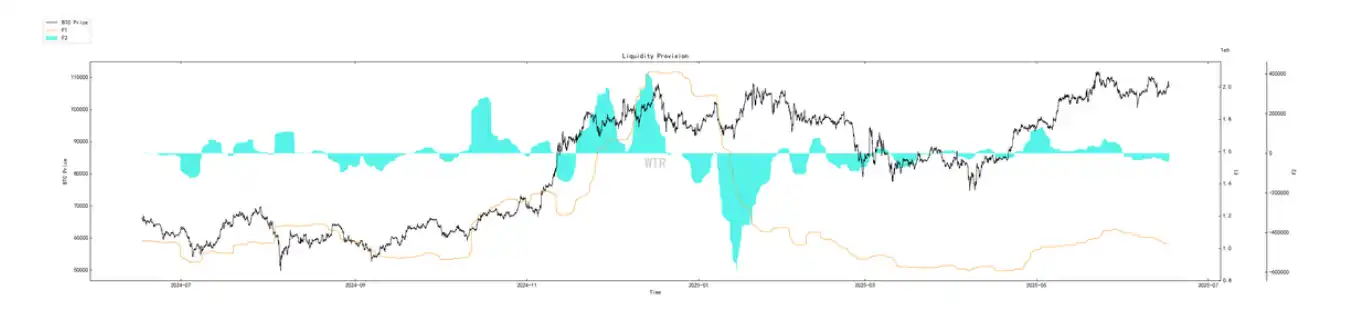
当前市场下的新⽣流动性供应量有所下滑,可能市场仍偏向于存量震荡博弈的结构。若此状态持续,可能市场会在当前结构下继续滑⾏,整体的⼤⽅向仍需时间等待。换个⻆度看,市场参与者可能也在观望和反复斟酌中进⾏博弈。
(下图 巨鲸综合得分)
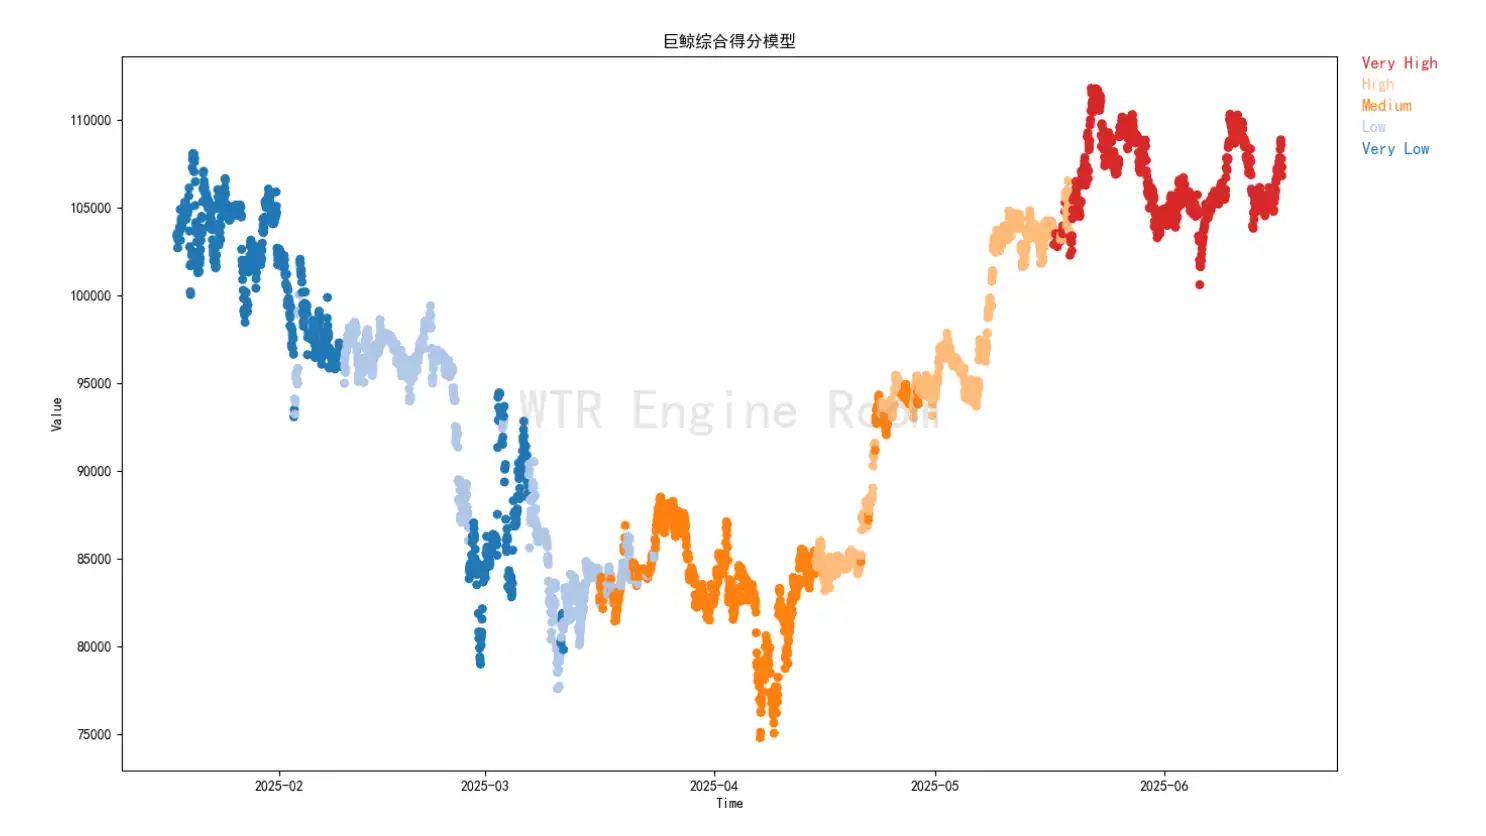
巨鲸仍保留着旺盛的流动性供给量,场内的⼤体量参与者仍在积极参与博弈当中。由于新⽣流动性供给量下滑,⽬前场内的巨鲸偏向于存量状态。存量巨鲸也是当前 BTC 维持⾼位震荡状态的主体。
(下图 BTC 交易平台趋势净头⼨)
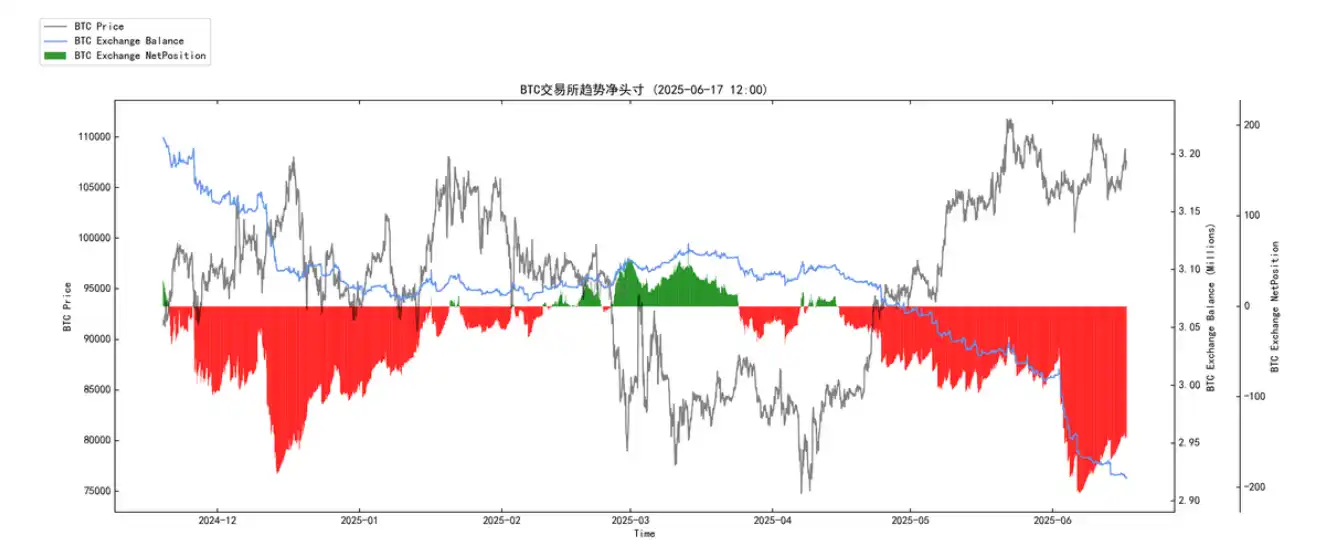
BTC 仍在交易平台进⾏积累活动。在⽬前阶段下,仍然保持着弱积累状态,交易平台内部 BTC 在少量流出交易平台。
(下图 增量模型)

短期参与者的供应量不断下滑,市场从 2025 年 4⽉上涨起始,⾄今仍是存量状态的上涨。此前周报提到过,由于场内存量购买⼒不断买⼊,叠加空头清算量的增多,⽬前市场来到了⾼位。若增量状态仍延续⽬前的状态,可能近期内⾏情⼤爆发的可能性会不断下降。市场仍需时间去博弈,可能都在等待⼀个变盘时机。
(下图 全球购买⼒)
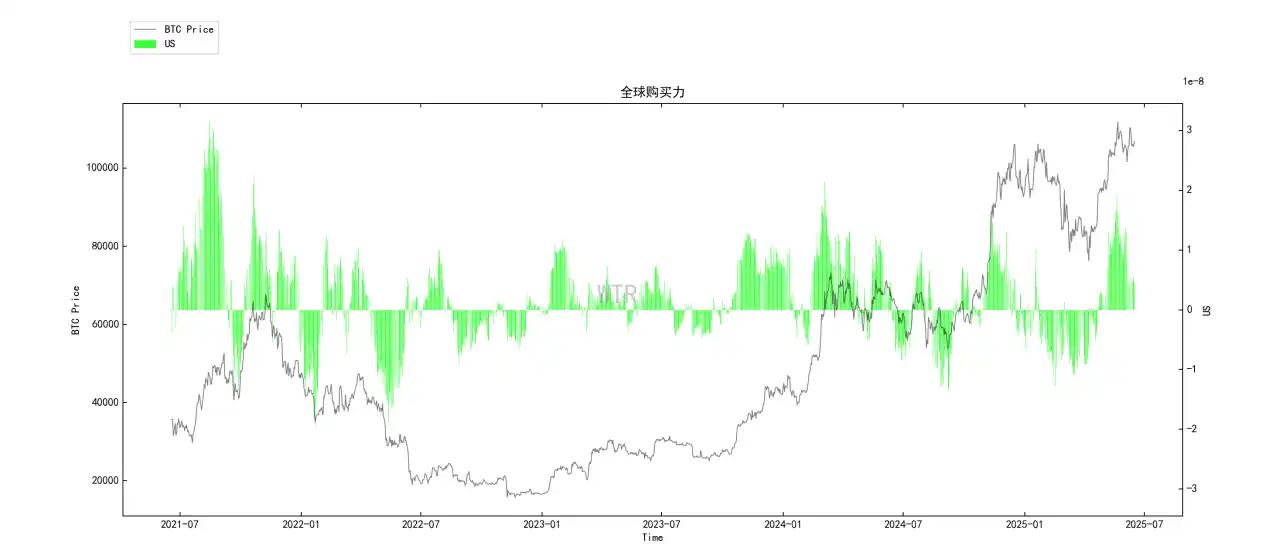
全球购买⼒⽬前在不断下降,可能在购买⼒逐渐收缩的情况下,市场在慢慢回归理性和冷静。
(下图 链上总筹码分布结构)
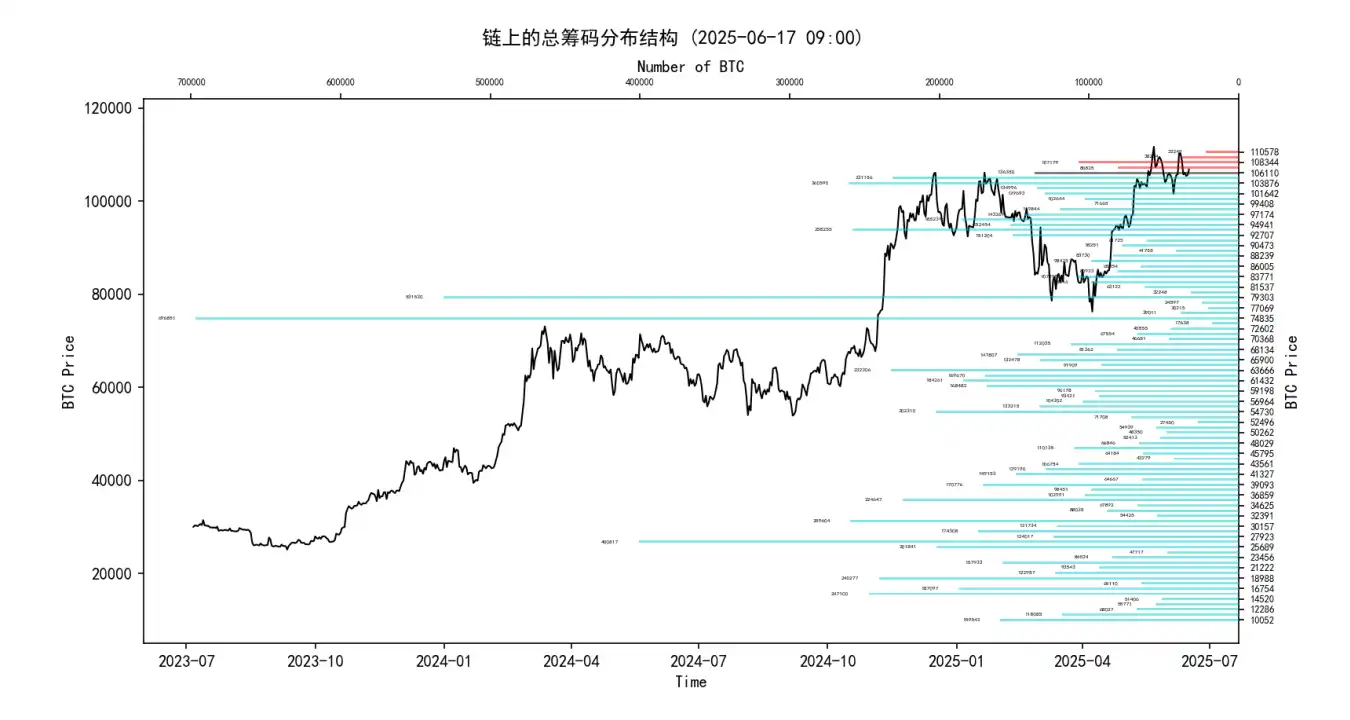
如果从筹码成交结构的⻆度看,⽬前的震荡结构⽀撑位在 102000 左右。同时,由于 110500 左右成交的筹码较少,可能增量未持续供给的情况下,价格上升的能量会在越过 110500 价位时越来越弱。
短期观测
• 衍⽣品⻛险系数
• 期权意向成交⽐
• 衍⽣品成交量
• 期权隐含波动率
• 盈利亏损转移量
• 新增地址和活跃地址
• 冰糖橙交易平台净头⼨
• 姨太交易平台净头⼨
• ⾼权重抛压
• 全球购买⼒状态
• 稳定币交易平台净头⼨
衍⽣品评级:⻛险系数处于红⾊区域,衍⽣品⻛险较⾼。
(下图 衍⽣品⻛险系数)
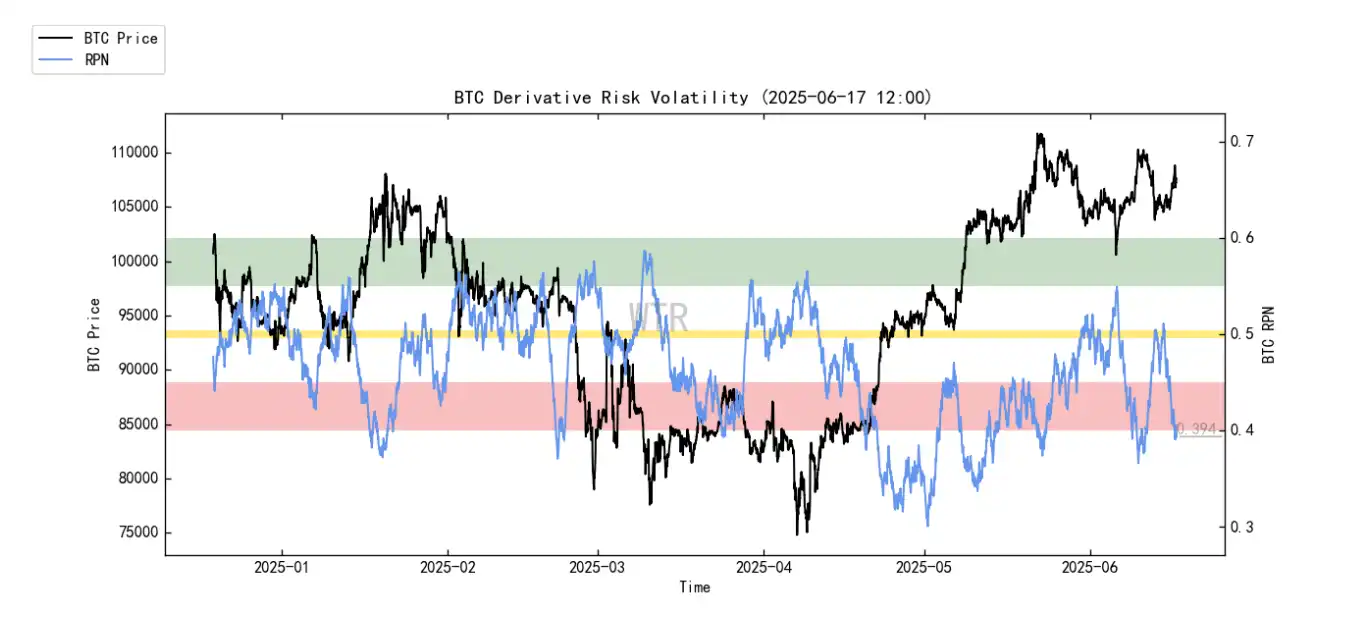
衍⽣品⻛险系数再次来到红⾊区域,本周单从衍⽣品来看市场保持震荡的概率更⾼,即使是轧空也幅度会⼩很多。
(下图 期权意向成交⽐)
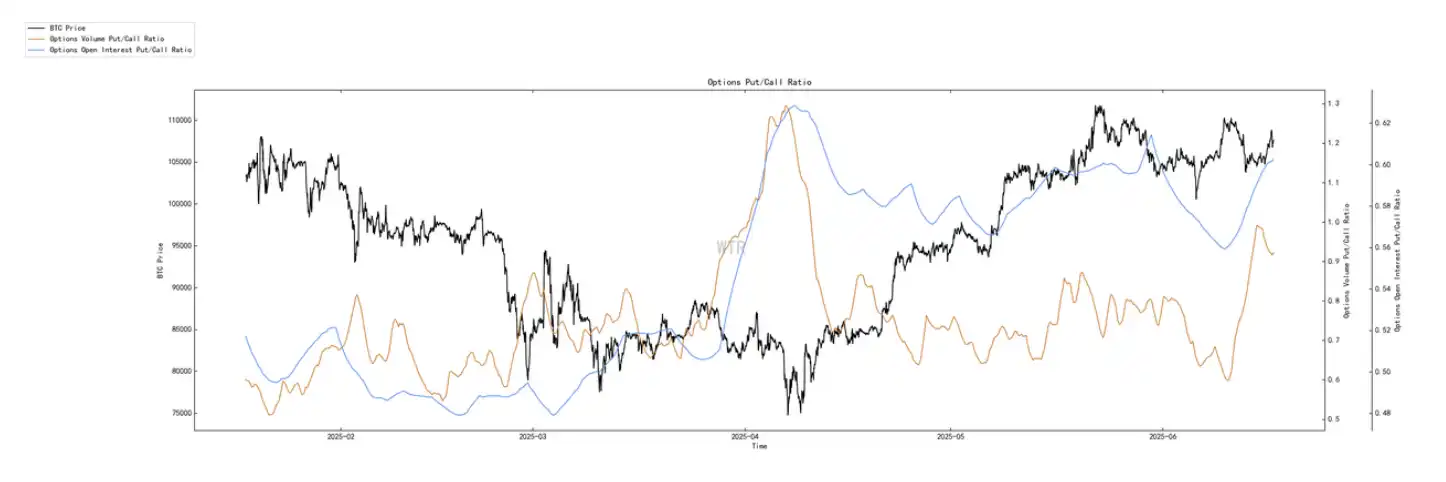
看跌期权⽐例和交易量增加,当前处于⾼位。
(下图 衍⽣品成交量)
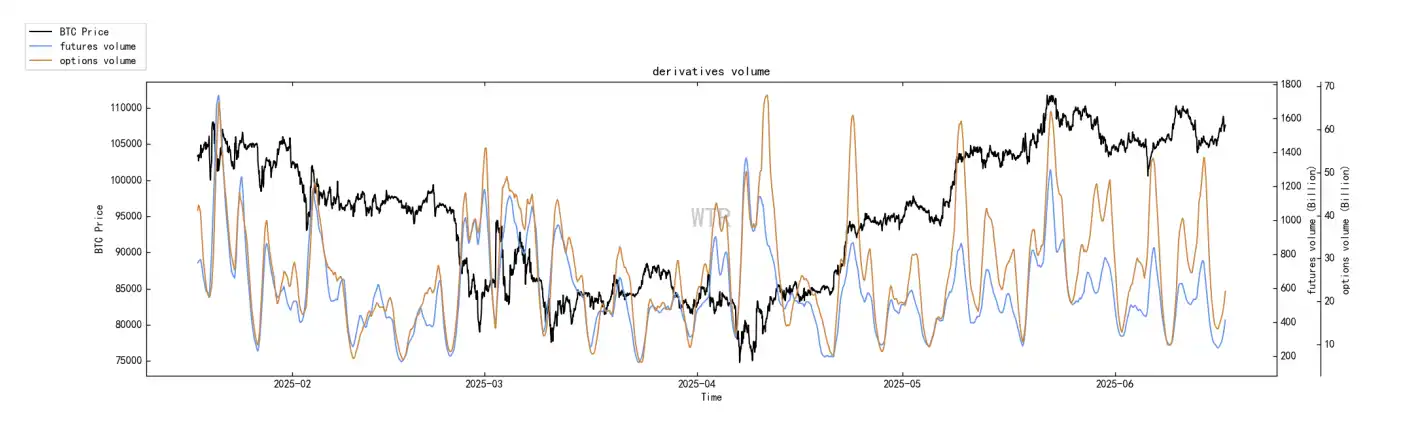
衍⽣品成交量处于低位。
(下图 期权隐含波动率)
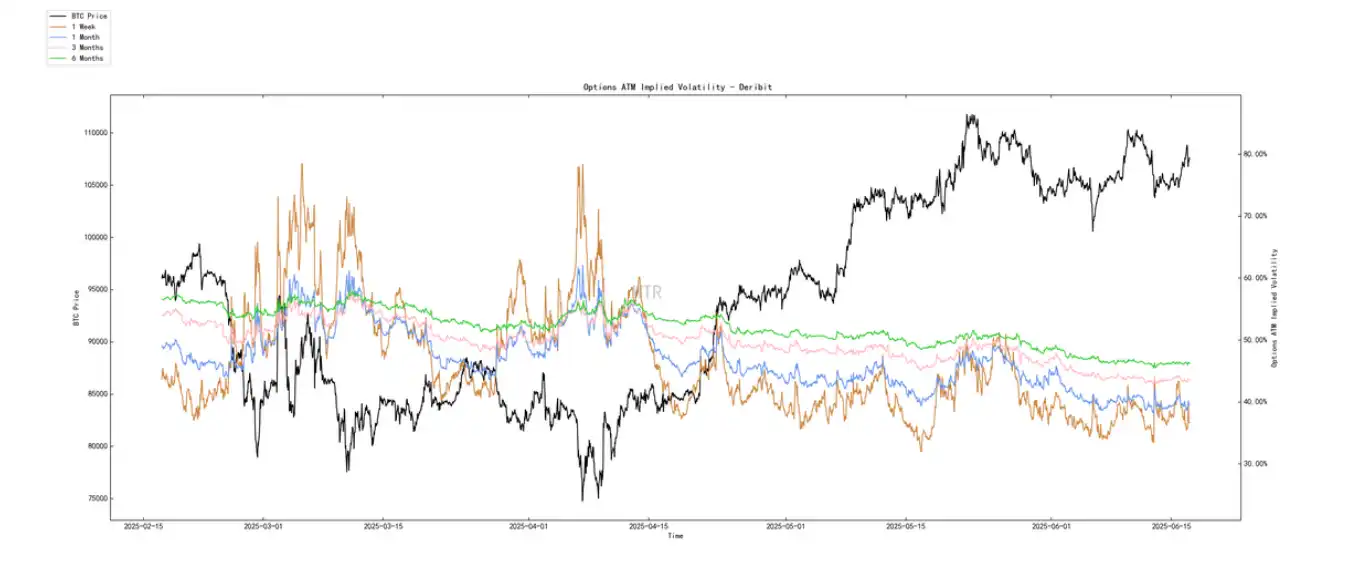
期权隐含波动率短期仅有低幅度波动。
情绪状态评级:中性
(下图 盈利亏损转移量)
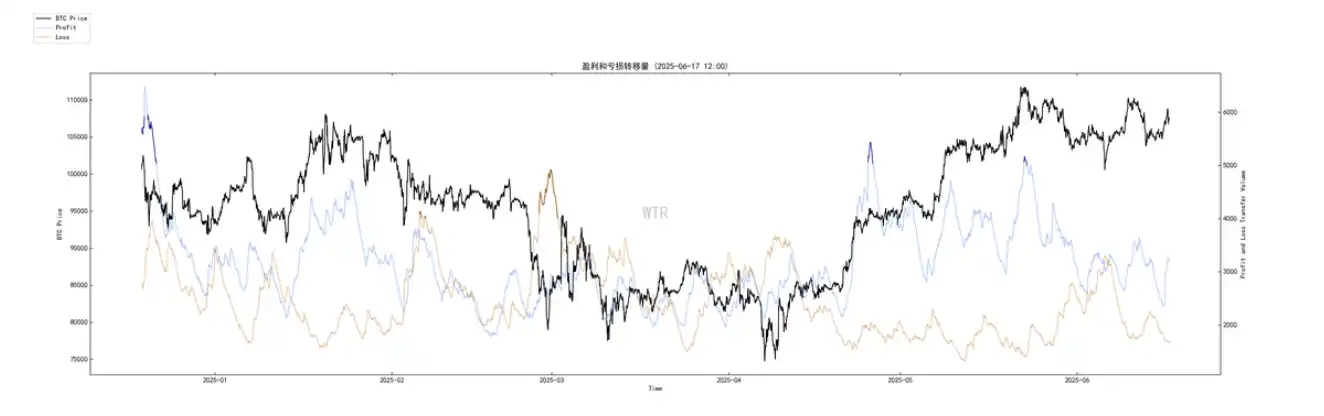
与上周⼀致,市场整体情绪表现还是处于相对中性谨慎的状态。
(下图 新增地址和活跃地址)
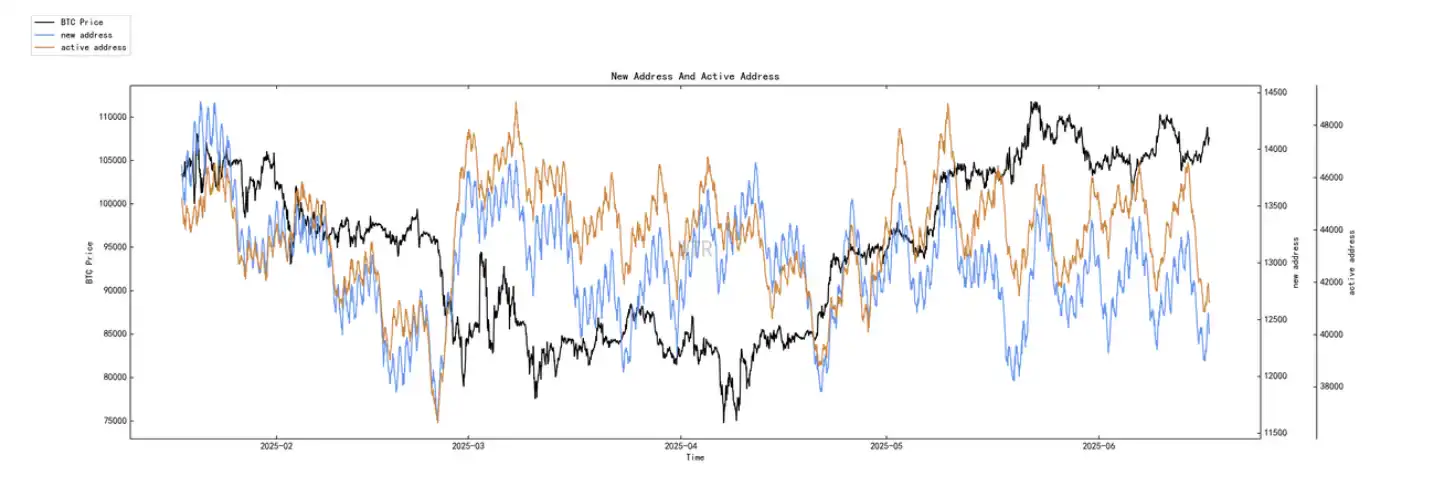
新增活跃地址处于中低位。
现货以及抛压结构评级:BTC 处于持续⼤量流出状态,ETH 有少量流出。
(下图 冰糖橙交易平台净头⼨)
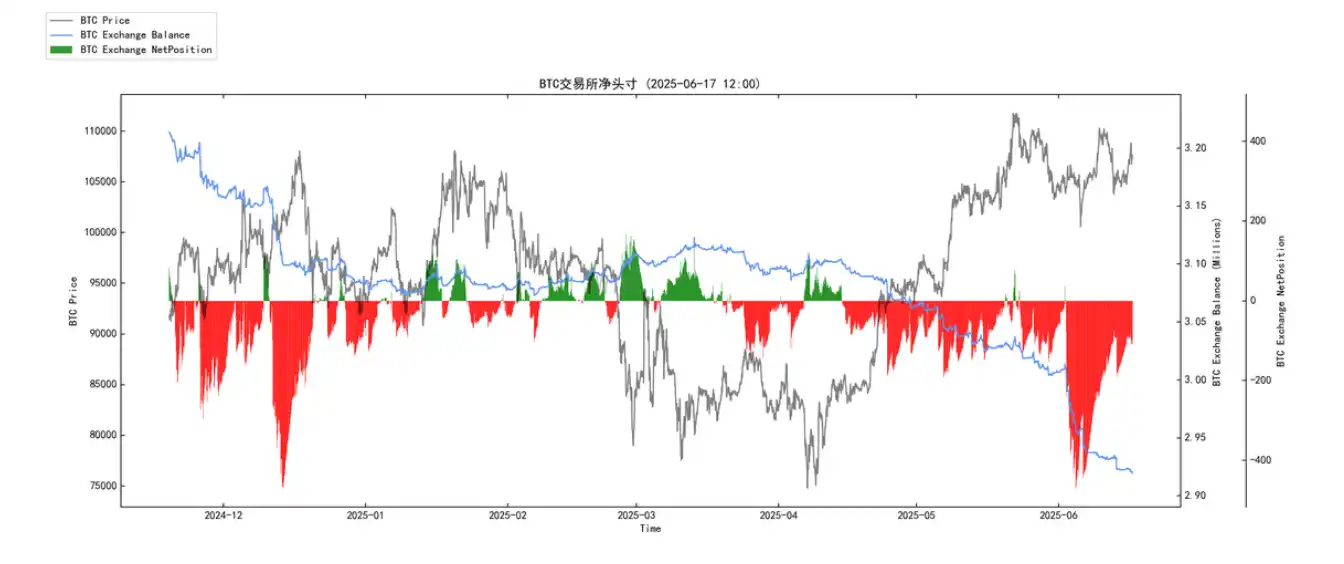
当前 BTC 持续⼤量流出。
(下图 E 太交易平台净头⼨)
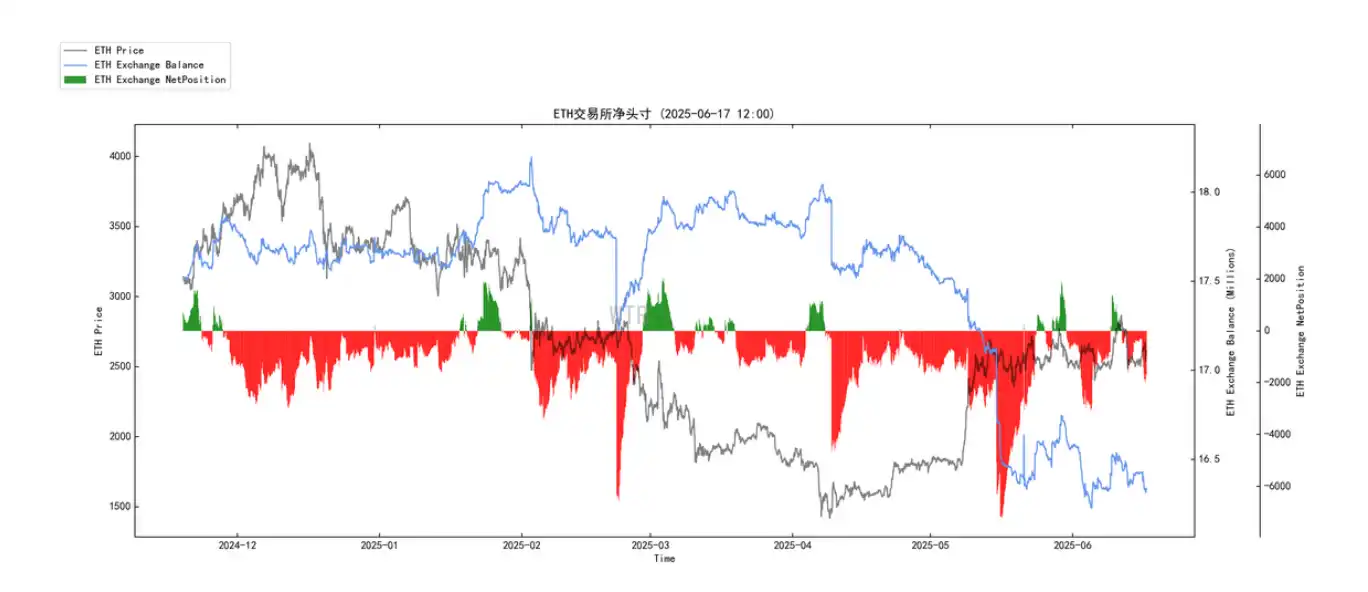
随着 ETH 价格的回升,ETH 交易平台内净头⼨有少量流⼊。当前已被消化,转为少量流出。
(下图 ⾼权重抛压)
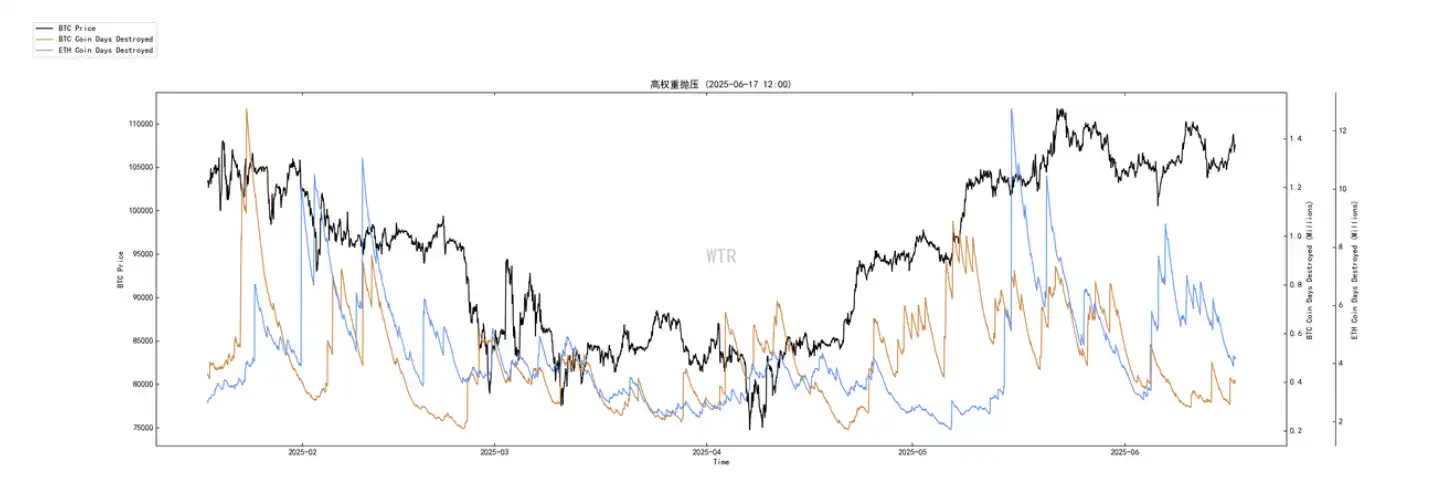
当前⽆⾼权重抛压。
购买⼒评级:全球购买⼒少量下降,稳定币购买⼒相⽐上周持平。
(下图 全球购买⼒状态)
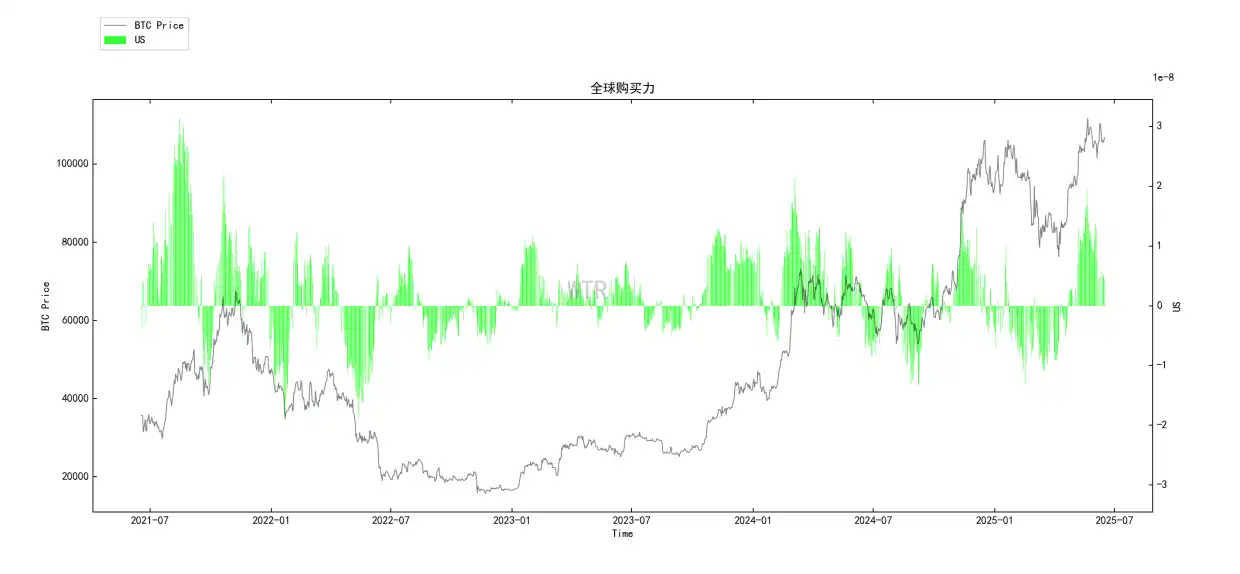
全球购买⼒少量下降,但仍处于正值。
(下图 USDT 交易平台净头⼨)
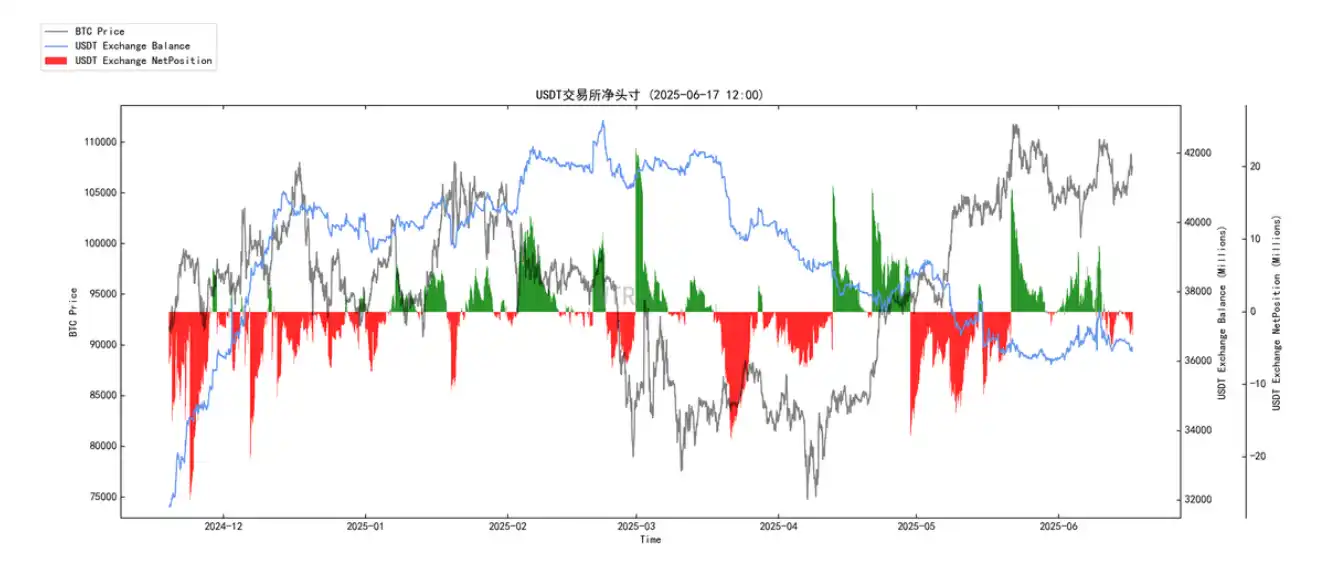
稳定币购买⼒相⽐上周持平。
本周总结:
消息⾯总结:
对于当前的市场,最直接的观察是,它处在⼀个屏息等待的状态。所有⼈的⽬光都聚焦在本周四凌晨的美联储,等待⼀个关于未来利率⾛向的信号。⻩⾦、原油、股票乃⾄加密资产的短期波动,似乎都成了对这个信号的提前押注或⻛险对冲。这是⼀个简单、清晰的事实,也是讨论的起点。
当然,⼀个重要的问题就出现了。市场的决定性因素仅仅是宏观货币政策,那么在过去⼀段时间相对明确的紧缩预期和地缘政治的紧张氛围下,为何以⽐特币为代表的数字资产并未出现崩溃性的下跌?我们看到的数据,反⽽是它展现出了与以往周期截然不同的韧性。这表明,那个最直接的答案,或许并不完整。⼀定有某种⼒量,在与宏观的压⼒相抗衡。意味着,需要将视线从表⾯移开,去探寻市场内部结构发⽣的变化。
为了理解这股新的⼒量,可以引⼊⼀个⽐喻:把整个数字资产市场想象成⼀个巨⼤的⽔库,其⽔位就是资产的价格。在过去,这个⽔库的⽔源主要依赖⾃然降⾬⸺也就是散⼾的资⾦和市场情绪。天⽓好(市场情绪乐观,宏观宽松),降⾬充沛,⽔位就上涨;天⽓不好(市场恐慌,宏观收紧),降⾬减少甚⾄⼲旱,⽔位就下降。因此,⽔库的⽔位对「天⽓」极为敏感。
⽽现在,情况发⽣了根本性的变化。在⽔库旁边,⼈们新建了⼀条巨⼤、坚固且源源不断的引⽔渠。这条引⽔渠,就是以⻉莱德等机构为代表的现货 ETF 通道。它不受短期天⽓变化的影响,每天都按照既定的⼯程设计,稳定地向⽔库中注⼊净⽔。在消息⾯中提到的「连续七周录得净流⼊」、「年初⾄今总流⼊额创下新⾼」,就是这条引⽔渠正在⾼效运转的直接证据。同时,上市公司将资产负债表的⼀部分换成⽐特币,或者链上⼤⼾的持续增持,可以看作是引⽔渠之外,⼜多了⼏⼝深井在源源不断地补⽔。现在,再来看⽔库的⽔位。外部的「天⽓」(美联储的利率决策、地缘政治冲突)依然重要,它决定了⽔库的「蒸发量」。
⼀个鹰派的信号,就像⼀阵⼲燥的热⻛,会加速蒸发,给⽔位带来下⾏压⼒。⼀个鸽派的信号,则像⼀场及时的阵⾬,会帮助⽔位更快上涨。当然,决定性因素已经改变。只要「引⽔渠」的净注⼊量,⻓期来看⼤于因「天⽓」恶化⽽产⽣的「蒸发量」,那么这个⽔库的⽔位,其⻓期趋势必然是向上的。
这就是市场韧性的来源:⼀股持续的、结构性的、⾮情绪化的买⼊⼒量(引⽔渠),正在抵消和吸收掉⼀股波动的、周期性的、情绪化的宏观压⼒(天⽓)。所以,现在可以回到最初的观察。⼈们紧盯着美联储,就像农⺠关⼼天⽓预报⼀样,这⽆可厚⾮,因为它直接影响短期的收成。但真正改变整个区域⽔⽂⽣态的,不是某⼀场⾬,⽽是那条已经建成的、彻底改变了⽔源供给结构的引⽔渠。
这⾥可以得出⼀个结论:市场短期内的确在看美联储的「脸⾊」⾏事,但这只是表象。市场的⻓期价值和稳定性,已经更多地取决于其内部的「结构性供⽔系统」⸺即机构化、合规化的资⾦流⼊通道。
因此,对于后续流程的准备,关键在于分析视⻆的切换:从过度关注短期、波动的「天⽓预报」,转向持续度量那条「引⽔渠」的流量和健康状况。因为只要引⽔渠的⽔流不⽌,⽔库的⽔位即使因暂时的⼲旱⽽有所回落,也终将蓄满,并最终溢出,流向更⾼的地⽅。
短期展望: 关注货币政策,管理波动。
这个阶段的核⼼是外部宏观环境的不确定性,它像「天⽓」⼀样,直接影响市场的短期情绪和价格波动。
核⼼焦点:
美联储货币政策: 利率决议、经济预期摘要、主席鲍威尔的讲话基调是市场的绝对焦点。任何鹰派或鸽派的信号都会被迅速放⼤。
关键经济数据: CPI(消费者物价指数)和 PPI(⽣产者物价指数)等通胀数据,将直接影响市场对美联储未来⾏动的预期。
市场表现:
• ⾼波动性、区间盘整。在没有明确的宏观利好或利空之前,市场⼤概率会维持在⼀个较⼤的区间内进⾏「拔河」,即结构性买盘与宏观抛压的对抗。
⻓期展望 : 度量「⽔流」,把握趋势
这个阶段的核⼼是市场内部的结构性变化,它像「引⽔渠」⼀样,为市场提供持续、稳定的价值⽀撑,决定了市场的⻓期趋势。
核⼼焦点:
• 结构性资⾦流⼊如何、监管框架的演进。
• 美国和⾹港等主要市场的监管政策明确化,是吸引更多主流资⾦⼊场的制度保障。
表现:
• 价值底线可能抬⾼: 尽管短期会有波动,但⻓期来看,由于持续的净买盘存在,市场的价值中枢和价格底部会稳步抬⾼。
链上⻓期洞察:
1. 市场的核⼼叙事,是其所有权结构的⼀场深刻且持久的转移。
2. 正从⼀个由短期流动性主导的投机市场,向⼀个由⻓期价值储藏主导的配置市场过渡。
3. 链上数据全⽅位地印证了这⼀进程;
4. 供应端正以前所未有的规模被锁定和固化,⽽需求端则出现了来⾃主流世界的、结构性的新⼒量。
• 市场定调:
当前的市场,正处在「结构性⽜市」中的「盘整消化期」。其表⾯的平静或波动,掩盖不了内在结构的持续强化。这是⼀个需要耐⼼,并要将分析重⼼从短期价格预测,转向度量⻓期结构性变化的阶段。
链上中期探查:
1. 新⽣流动性下滑致市场偏向存量震荡,可能参与者在观望中博弈。
2. 巨鲸流动性供给旺盛,存量状态⽀撑 BTC⾼位震荡。
3. BTC 在交易平台弱积累,当前少量流出交易平台。
4. 短期参与者供应下滑,存量结构显著。
5. 全球购买⼒下降,市场逐步回归理性与冷静。
6. 筹码结构显⽰⽀撑位 102000,110500 上⽅上涨能量趋弱。
• 市场定调:
存量博弈、⾼位震荡
当前市场以存量博弈为主,可能要在⾼位震荡中等待变盘时机。
链上短期观测:
1. ⻛险系数处于红⾊区域,衍⽣品⻛险较⾼。
2. 新增活跃地址较处于中低位。
3. 市场情绪状态评级:中性。
4. 交易平台净头⼨BTC 处于持续⼤量流出状态,ETH 有少量流出。
5. 全球购买⼒少量下降,稳定币购买⼒相⽐上周持平。
6. 短期内跌不破在 95000~100000 概率为 80%;
• 市场定调:
短期内整体市场情绪较为中性谨慎且⽆狂热或恐慌迹象。如⽆特别突发消息⾯影响下,本周预期仍与上周⼀致,市场受衍⽣品影响的同时偏震荡,出现直接⼤回撤和⼤幅度的轧空的概率较低。
⻛险提⽰:以上均为市场讨论和探索,对投资不具有指向性意⻅;请谨慎看待和预防市场⿊天鹅⻛险。
本文来自投稿,不代表 BlockBeats 观点。
免责声明:本文章仅代表作者个人观点,不代表本平台的立场和观点。本文章仅供信息分享,不构成对任何人的任何投资建议。用户与作者之间的任何争议,与本平台无关。如网页中刊载的文章或图片涉及侵权,请提供相关的权利证明和身份证明发送邮件到support@aicoin.com,本平台相关工作人员将会进行核查。


