Analyst Chen Shu: Short-term focus on the breakout of the 6.14 range oscillation, midday analysis and strategy for Bitcoin and Ethereum
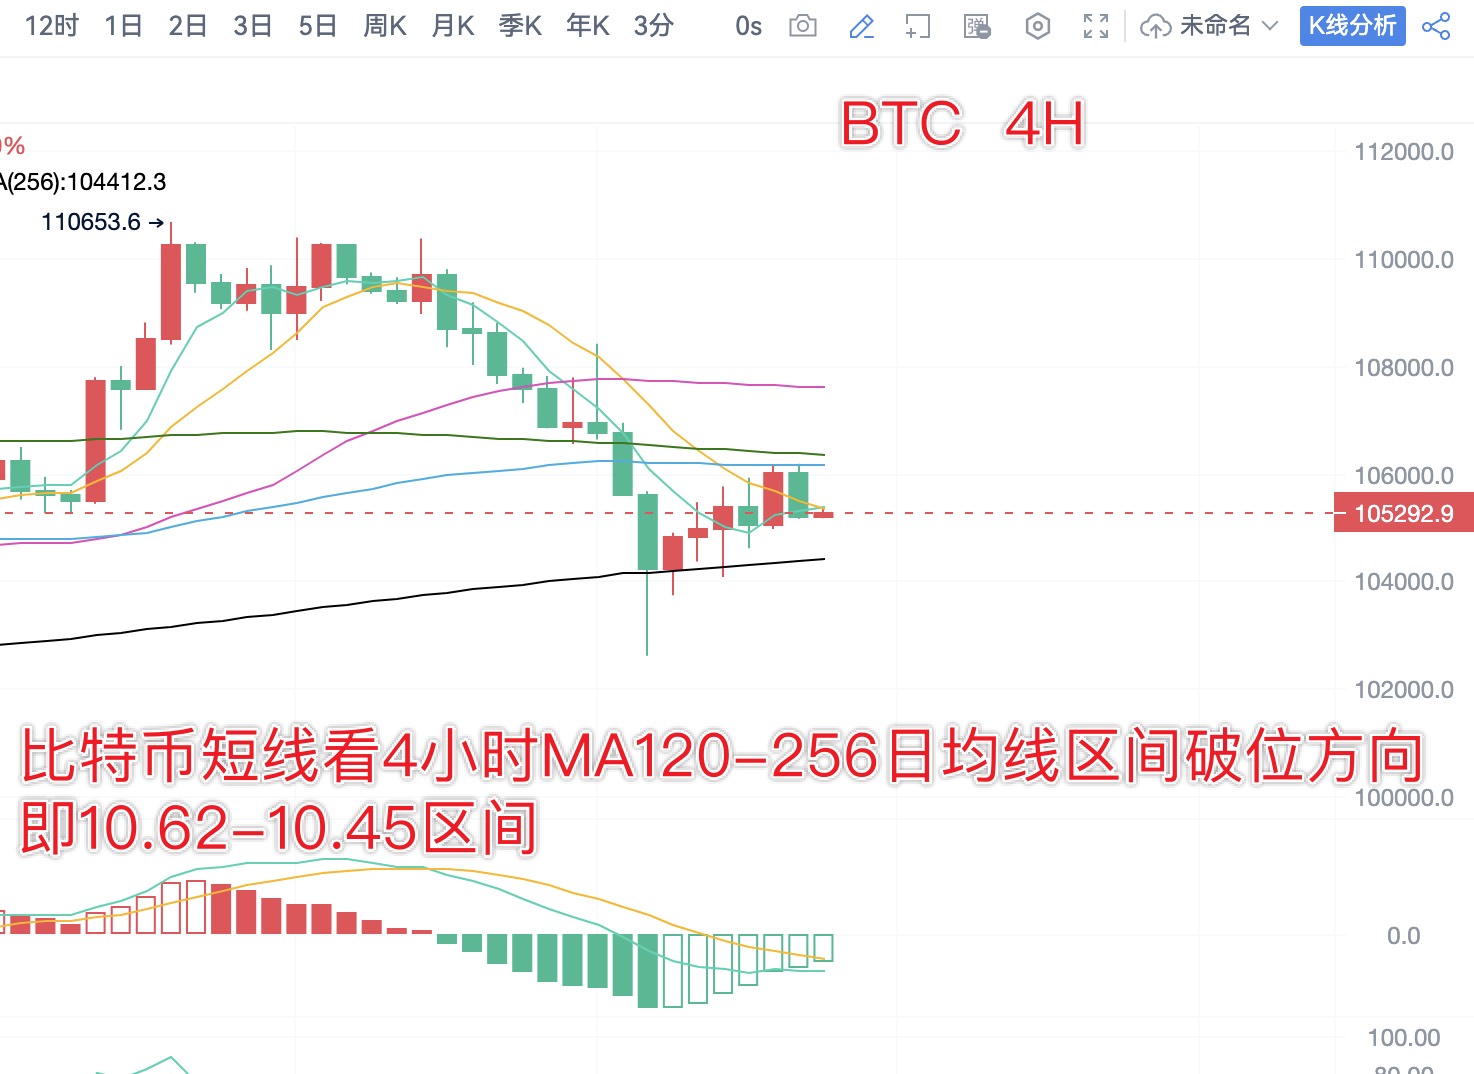
From the daily chart of Bitcoin, yesterday formed a long lower shadow red candlestick, with the price touching the MA30 moving average at 10.65 and starting to make a slight pullback. It is crucial to pay attention to whether the subsequent price can break through and stabilize above 10.65. The support level to watch is the 4-hour MA256 moving average at 10.45, while the resistance level is around 10.62. First, focus on the breakout situation of the range 10.62-10.45.
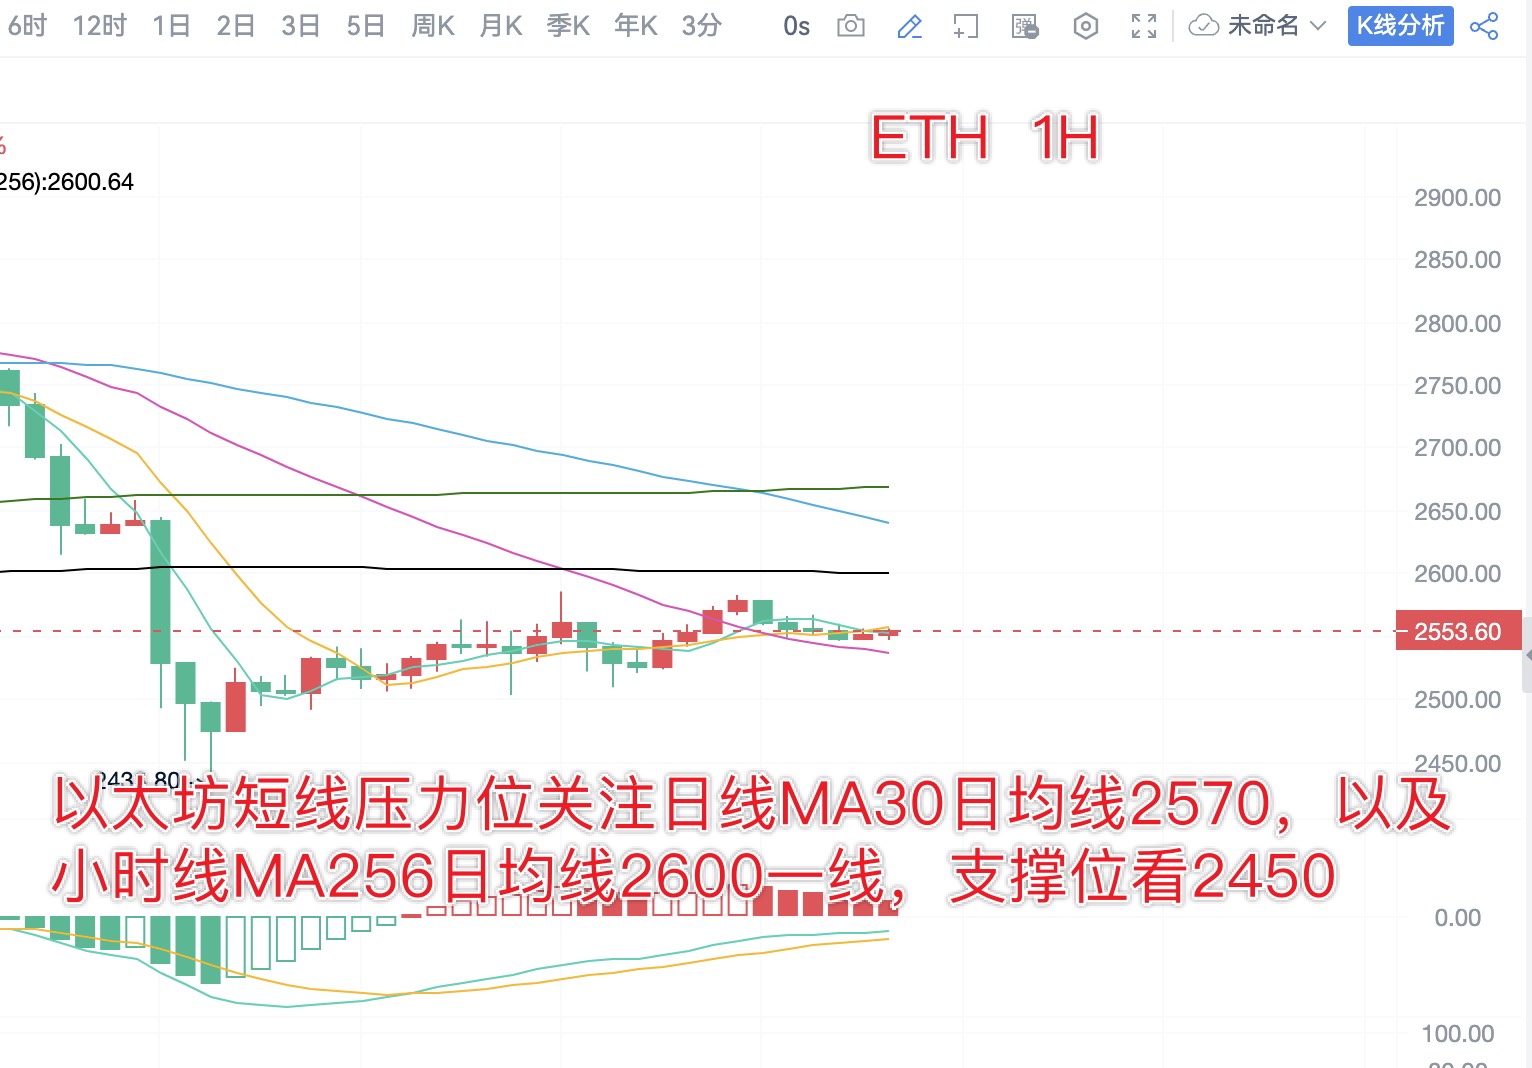
From the daily chart of Ethereum, yesterday's daily candlestick formed a long lower shadow green candlestick, with the price currently falling below the MA30 moving average at 2570. Pay attention to whether the subsequent price can break through and stabilize above 2570. On the 4-hour chart, the short-term oscillation range remains between the MA120 and MA256 moving averages, specifically in the 2600-2450 range. First, focus on the breakout direction of this range.
Midday operation strategy (writing time: 14:00):
BTC: Short at 10.6, target 10.5/10.45; Long at 10.45, target 10.55/10.6
ETH: Short at 2570/2600, target 2520/2480; Long at 2500/2450, target 2550/2600
The daily analysis strategy has a very high win rate! Analysis is not easy, so I hope everyone can give a free follow, bookmark, like, and comment. Thank you all, and feel free to leave a message below for discussion; I will reply to each one!

免责声明:本文章仅代表作者个人观点,不代表本平台的立场和观点。本文章仅供信息分享,不构成对任何人的任何投资建议。用户与作者之间的任何争议,与本平台无关。如网页中刊载的文章或图片涉及侵权,请提供相关的权利证明和身份证明发送邮件到support@aicoin.com,本平台相关工作人员将会进行核查。


