The technical aspects intertwine with macro variables, and the market faces critical nodes for breakthroughs or pullbacks.
Written by: White55, Mars Finance
Prologue: Price Breakthrough and Whale Maneuvering
On June 10, 2025, the price of Ethereum surged past $2,827, reaching a 15-week high. Behind this figure, a liquidation storm involving $1.8 billion in short positions is brewing. In this seemingly coincidental market movement, the trading trajectory of a mysterious whale has become a key annotation for interpreting market sentiment.
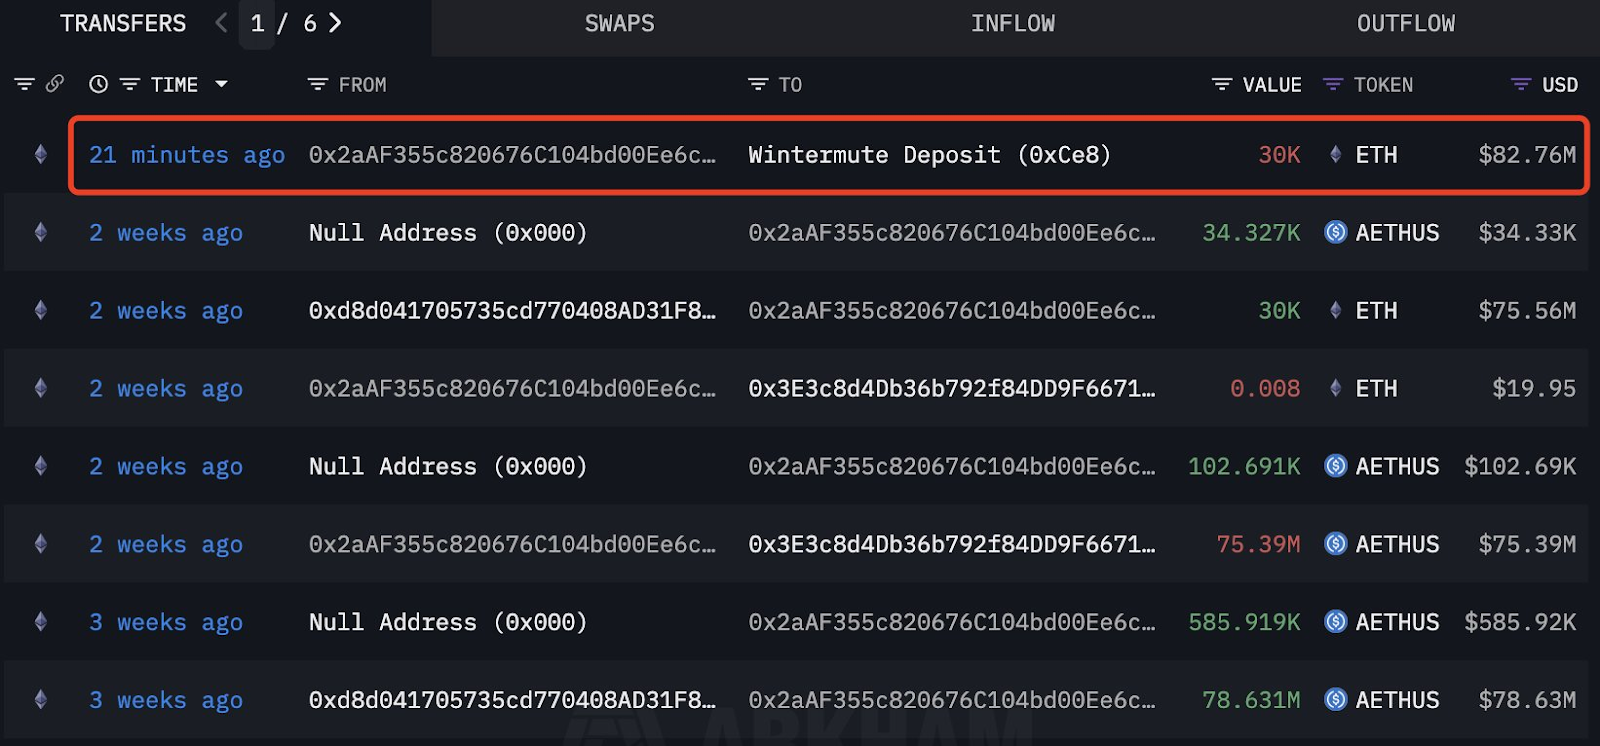
Trading activity of ETH whales. Source: Lookonchain/X
According to on-chain tracking platform Lookonchain, an anonymous address executed two precise strikes within 44 days:
- First Round (April 27): Accumulated 30,000 ETH at an average price of $1,830 through Wintermute OTC, costing $54.9 million;
- Second Round (May 27): Sold the same amount at a price of $2,621, earning $23.73 million, with a return of 43%;
- Final Harvest (June 10): Again sold 30,000 ETH through OTC for $82.76 million, locking in a profit of $7.3 million, totaling $31 million in gains.
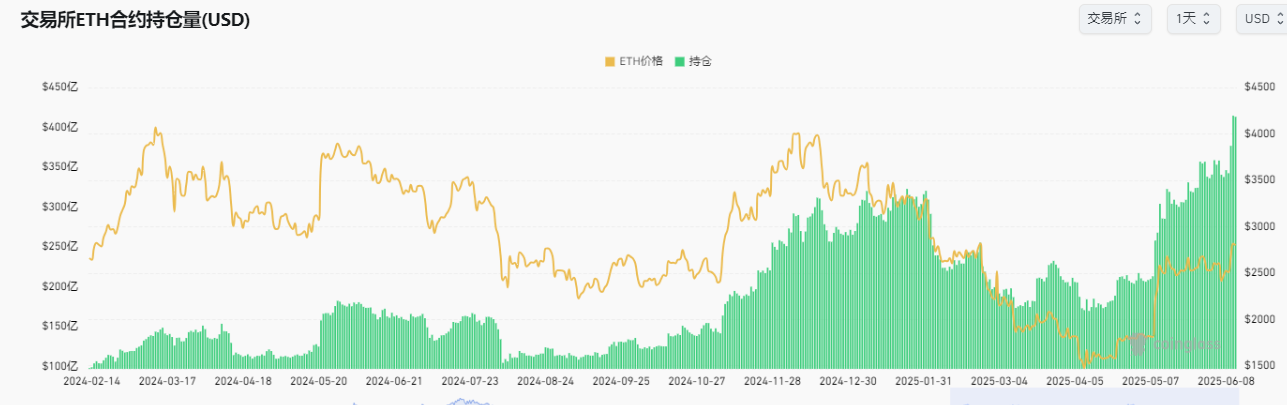
Such operations are by no means isolated. CoinGlass data shows that Ethereum futures open interest (OI) has first surpassed the $40 billion mark, with market leverage nearing a critical point. The current liquidity map presents a delicate balance: around $2,600, there is a $2 billion liquidation risk for long positions, while above $2,900, there lurks $1.8 billion in short liquidation ammunition. This confrontation between bulls and bears resembles a replica of the CDO market in "The Big Short"—any directional breakthrough will trigger a chain reaction.
Chapter Two: Ecological Expansion and Value Cracks
Behind the price frenzy, the Ethereum ecosystem is undergoing structural changes.
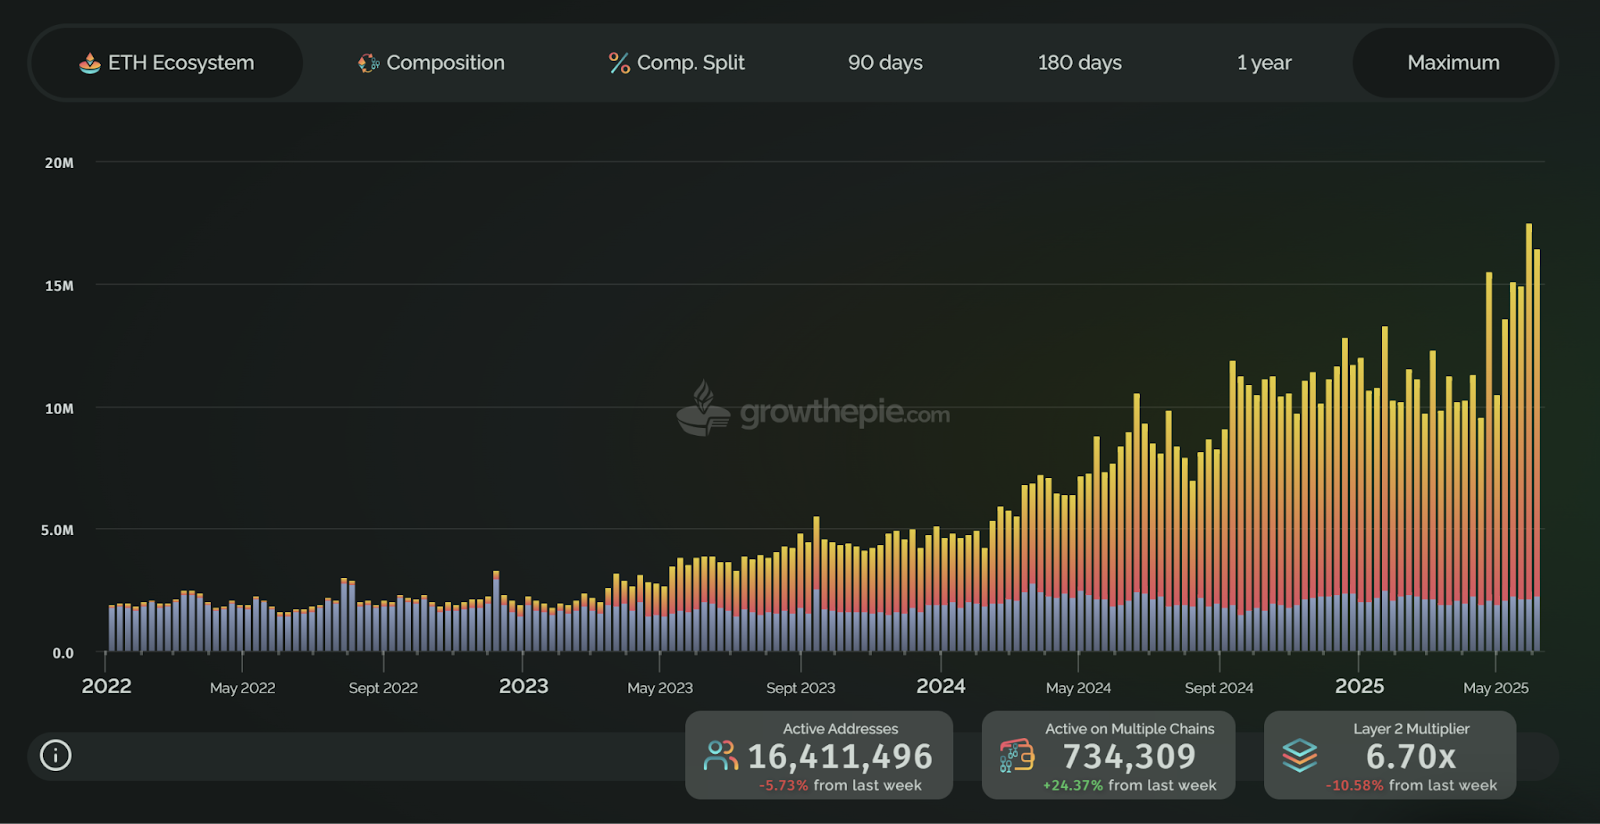
Ethereum weekly address participation chart. Source: growthepie
Data from growthepie shows that independent active addresses surged by 70% in the second quarter, peaking at 16.4 million on June 10. Among them, the Base network accounted for 72.81% (11.29 million addresses), becoming the growth engine, far exceeding Ethereum's mainnet at 14.8% (2.23 million addresses). This model of "satellite chains feeding back to the mainnet" is starkly different from the narrative logic of the DeFi Summer in the 2020s.
Although Ethereum still holds a 61% share of the DeFi market with a TVL of $66 billion, its core revenue model shows signs of concern:
- Fee Collapse: In the past 30 days, network fees totaled only $43.3 million, plummeting 90% compared to before the Cancun upgrade;
- Staking Yield Dilemma: While Blob technology reduces Layer 2 costs, staking yields remain sluggish at an annualized 3.12%, far inferior to competitors like Solana;
- Regulatory Shackles: The SEC's scrutiny of ETH staking has led to a net outflow of $369 million from spot ETF funds over eight consecutive days, revealing cracks in institutional faith.
This contradiction is materialized in Glassnode's on-chain data: the proportion of "diamond hands" addresses holding ETH for over a year dropped sharply from 63% to 55%, while short-term holders' selling volume surged by 47%. When technological upgrades fail to translate into gains for holders, ecological prosperity instead becomes a driver of value dilution.
Chapter Three: The Blood-Soaked Compass of the Derivatives Market
The futures market is rife with undercurrents, with ETH futures open interest (OI) historically surpassing $40 billion, indicating high market leverage. The significant rise in open interest foreshadows potential volatility.
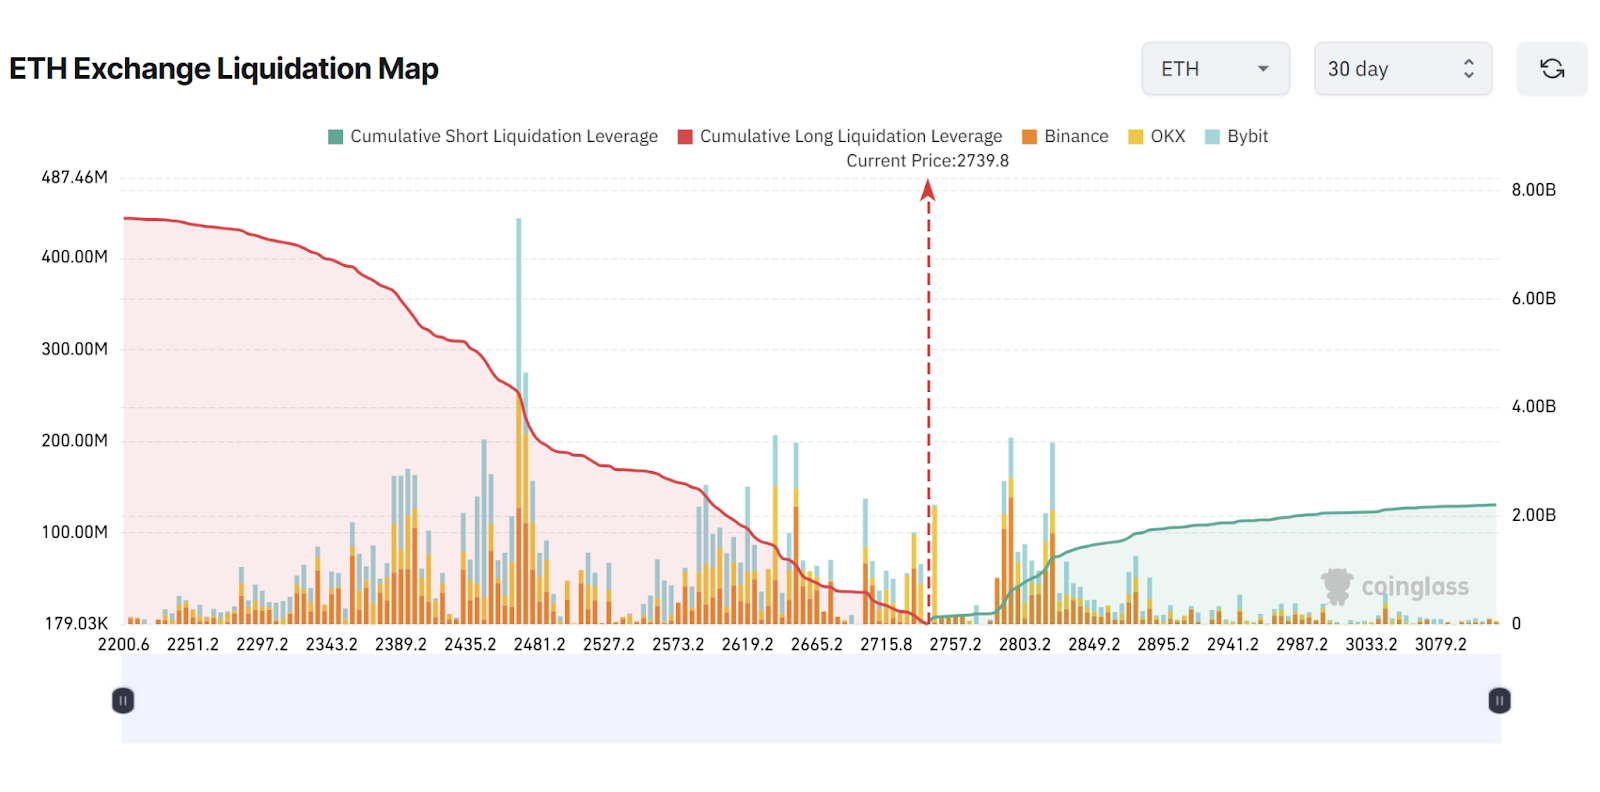
Ethereum liquidation chart. Source: CoinGlass
CoinGlass's liquidation heatmap reveals the brutal logic of capital games:
- Long Minefield: The $2,600-$2,665 range accumulates $2 billion in forced liquidation risk, coinciding with the 50% Fibonacci retracement level for the 2024 bull market;
- Short Graveyard: Above $2,900, $1.8 billion in short positions hang by a thread, corresponding to the historical low ETH/BTC exchange rate of 0.019;
- Institutional Duality: CME Ethereum futures open interest accounts for 9%, contrasting with Bitcoin futures' 24% institutional dominance, suggesting traditional capital remains cautious.
The distorted prosperity of the derivatives market is merely a manifestation of liquidity traps. When perpetual contract funding rates remain negative and the buy-sell ratio falls below 1, the market has entered an "extreme bearish" state. In this environment, the whale's OTC cash-out resembles a signal of exit before the doomsday carnival—after all, historical data shows that the probability of a black swan event occurring within three months after record open interest is as high as 68%.
Chapter Four: Technical Codes and Macro Variables
From the perspective of candlestick patterns, the current market hides secrets:
- Volatility Squeeze: The daily Bollinger Bands have narrowed to 5%, the lowest level since February 2024, indicating a breakthrough is imminent;
- Weekly Paradox: Prices are stable above the 50-week and 100-week EMA, but the MACD histogram shows a top divergence, with an RSI value of 42 indicating insufficient upward momentum;
- Fibonacci Shackles: A daily closing price of $2,800 will become the dividing line for bulls and bears; a breakthrough would open theoretical space of $3,200-$3,500, while a failure could lead to a retest of $2,500 for price support.
On the macro level, US-Russia geopolitical negotiations and expectations of interest rate cuts by the Federal Reserve create dual disturbances. CME interest rate futures indicate that the market has priced in a 79% chance of 2-3 rate cuts in 2025; if the actual path deviates, the crypto market will be the first to bear the brunt. Standard Chartered Bank warns that if the RWA (real-world assets) narrative fails to materialize in Q3, Ethereum may face a risk of $100 billion in market cap evaporation.
Epilogue: The Eve of a Paradigm Revolution
Ethereum stands at a historical crossroads:
- Reconstruction of the Staking Economy: By raising the staking limit for validator nodes to 2,048 ETH through EIP-7251, optimizing the exit mechanism to alleviate liquidity crises;
- Layer 2 Value Feedback: Mandating Layer 2s like Arbitrum to allocate part of their fee income to the mainnet, addressing the paradox of "ecological prosperity, mainnet anemia";
- Regulatory Breakthrough: If the SEC's ruling on the 21Shares staking ETF passes in Q3, it is expected to bring a short-term increase of 15-20% and lock in 8% of the circulating supply.
As Peter Brandt said, after breaking through the congested pattern at $2,800, Ethereum may embark on a "moonshot" rally to $5,232. However, caution is warranted; the essence of this capital game remains a liquidity hunt driven by leverage—when $1.8 billion in short positions become fuel, the market will ultimately verify: who is truly steering the trend, and who is merely swimming naked.
免责声明:本文章仅代表作者个人观点,不代表本平台的立场和观点。本文章仅供信息分享,不构成对任何人的任何投资建议。用户与作者之间的任何争议,与本平台无关。如网页中刊载的文章或图片涉及侵权,请提供相关的权利证明和身份证明发送邮件到support@aicoin.com,本平台相关工作人员将会进行核查。


