
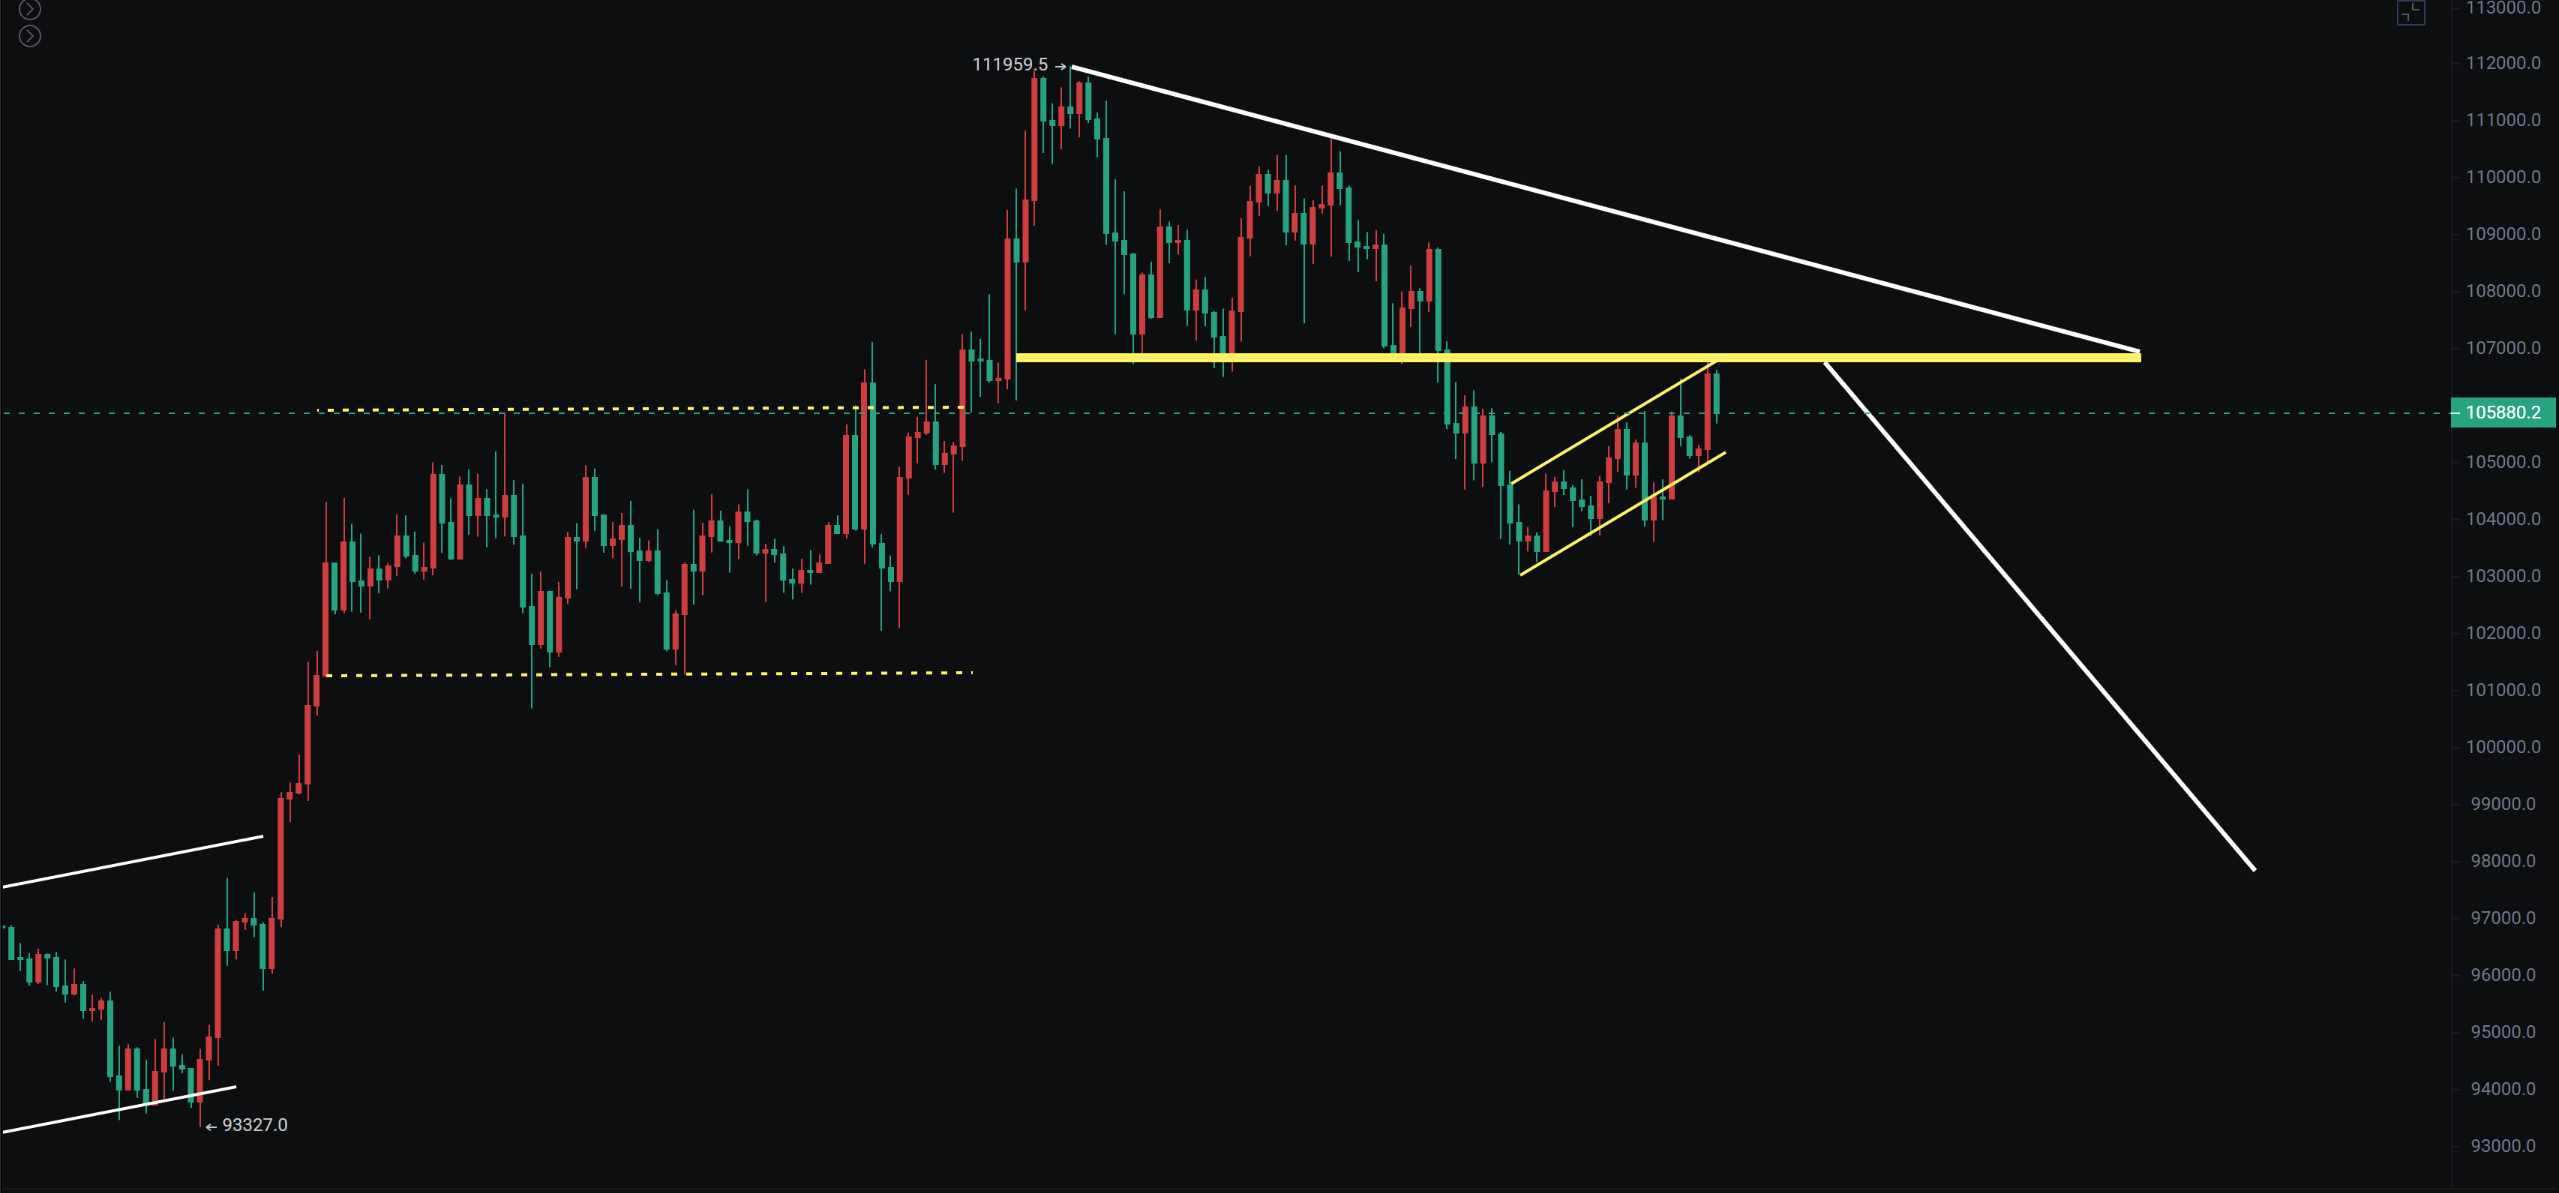
大饼下跌还未结束,反弹考验支阻互换位107000,日线强卖组合加上黄昏之星,跌破107000的支撑目前反弹变压力,时间空间还不够,仍然存在下跌三浪。
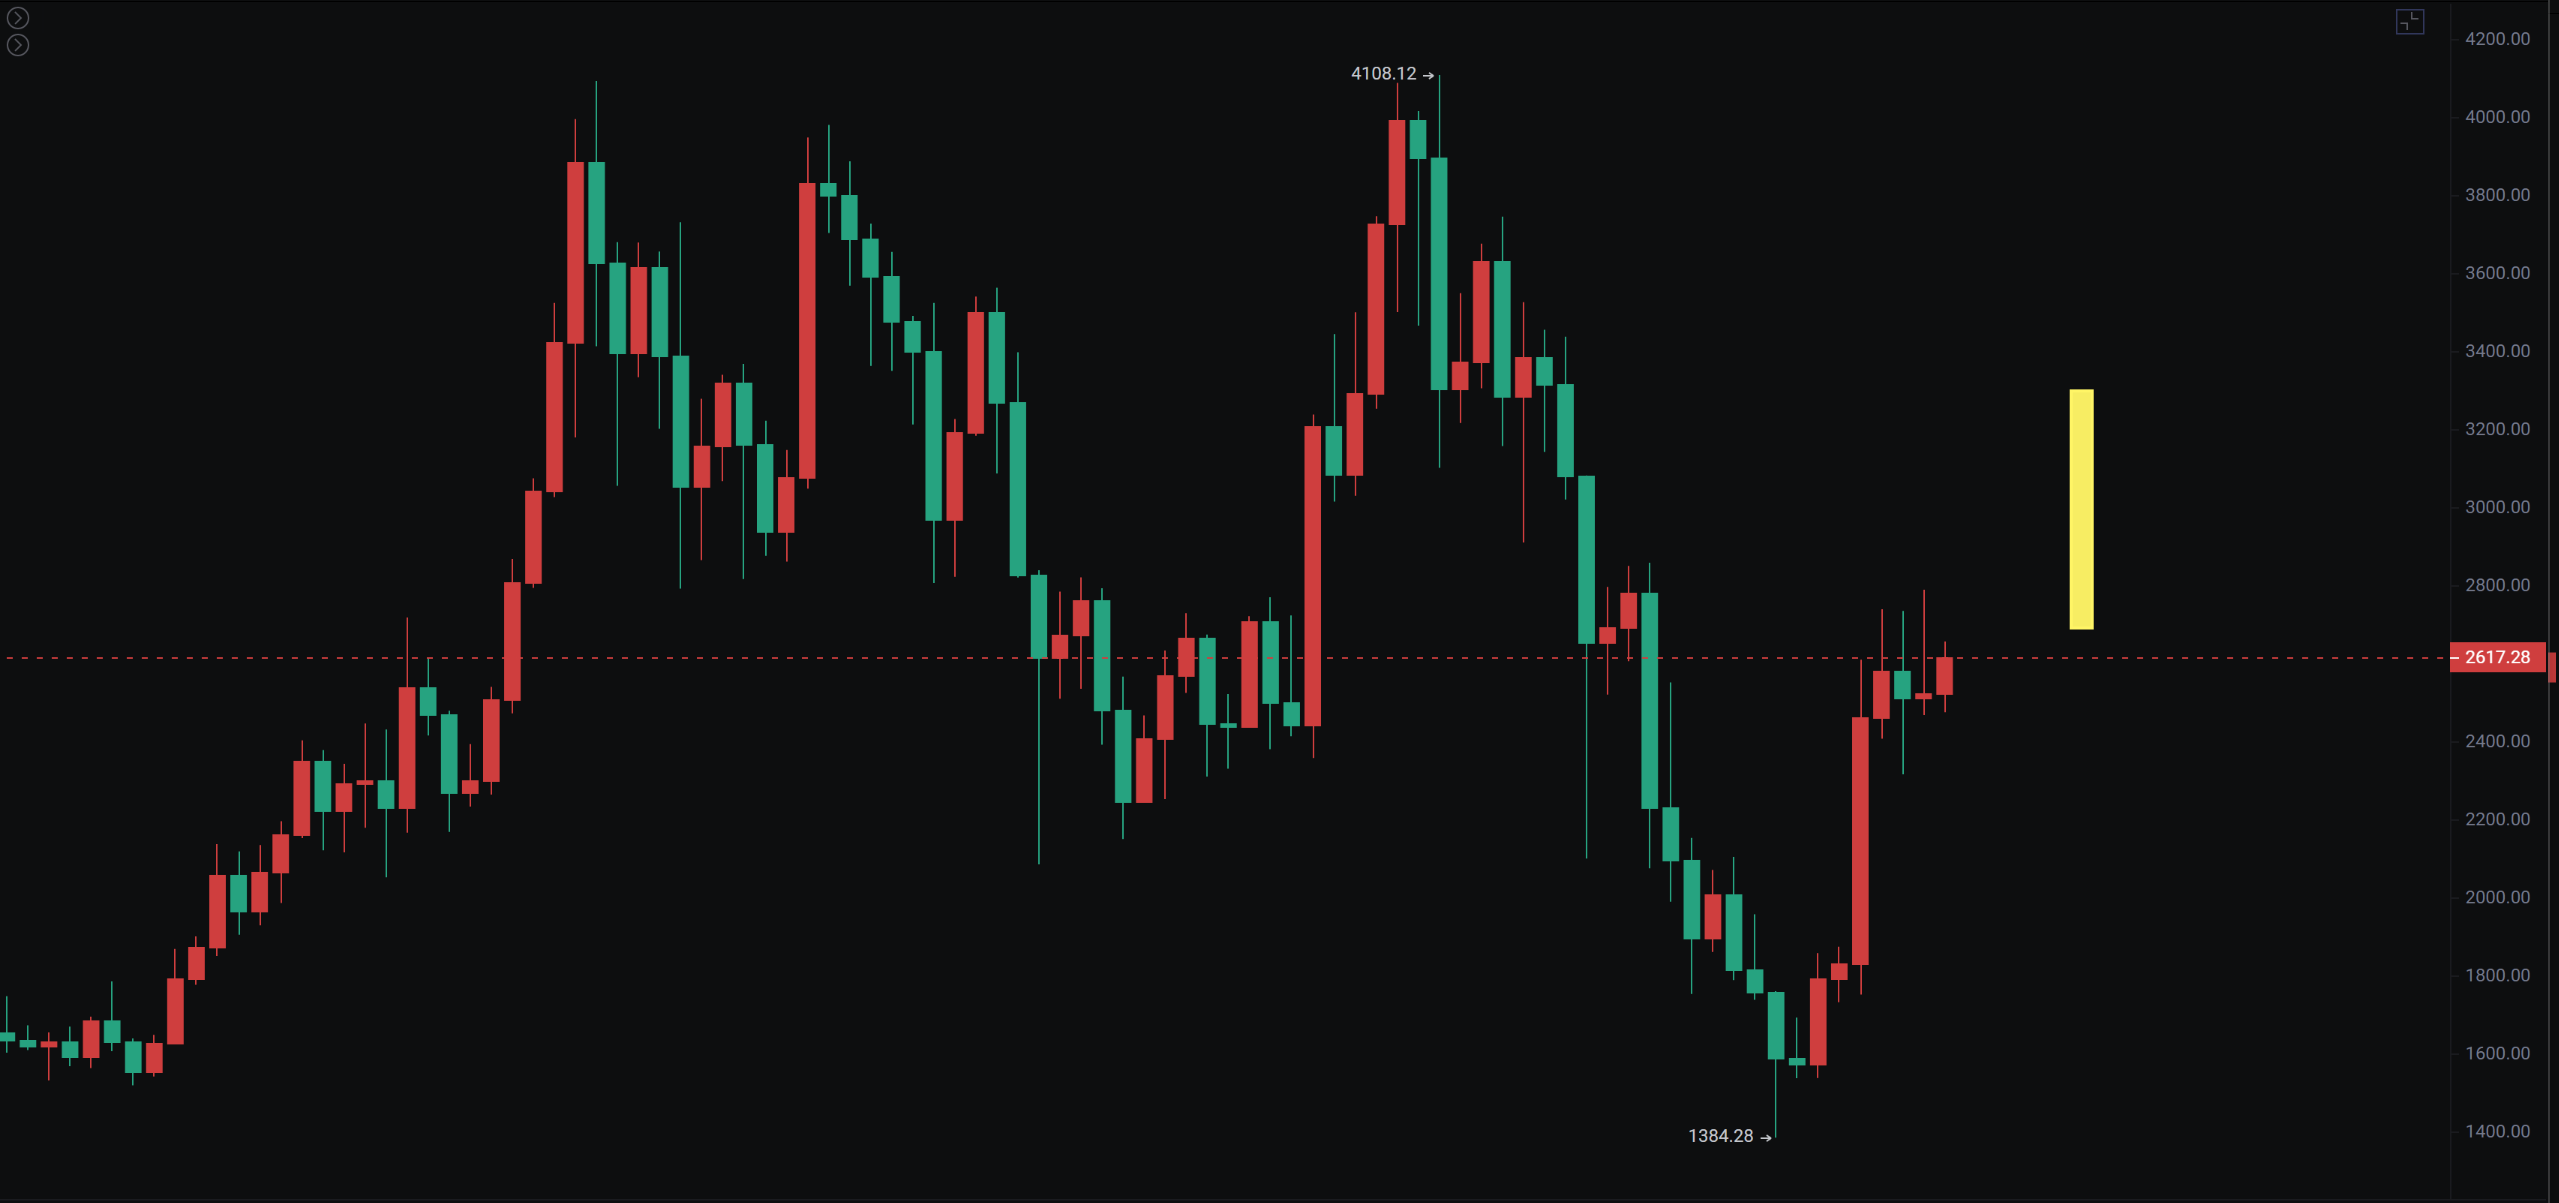
以太一直维持高位震荡,周线走出抛砖引玉形态,后续继续看涨。日线支撑在2300,该区域附近可以分批抄底,不排除有插针机会。
对于美股的走势现在确实是走的比较纠结,窄幅震荡了十几天的时间,而且距离前高只还有几个点的空间,也是完成了谐波形态的0.886又继续反弹,关注公子会持续分析美股,这里一定要注意对于关税的滞后影响,经济衰退是必然,那么就看关税影响是否引爆这个雷。
大饼
日线假突破后跌回,上升趋势跌破,当前仍属于弱势回调,四小时走出了上升通道,目前正处于107000支阻互换位阻力下方,鉴于美股走势较强,加之消息面李在明当选棒子总—统,此前李在民曾承诺推动批准加密货币ETF,并提拟发行基于韩元的稳定币,所以短时间要关注消息面的影响。

Cme缺口在96000至98000,而假突破下跌等比下跌也是在98000附近。今天反弹触碰布林中轨承压,10万也是关键支撑,这两个地方可以分批接。
支撑:96000—98000—100000
压力:107000—110000—112000
以太
周线走出抛砖引玉形态这是看涨的信号,这一波同大饼回调好,有机会继续走出大阳线,指向3300。
日线震荡了半个多月,仍然还在2300至2800之间。2800作为关键的牛熊分水岭,仍然还在起作用,而且从周线的角度来看,以太坊不排除走大级别震荡,就是一旦突破2800至3300,不排除有机会去4000。
支撑:2100—2200—2300
压力:2800—3300—4100
如果你喜欢我的观点,请点赞评论分享,我们一起穿越牛熊!!!
文章具有时效性,仅供参考实时更新
专注k线技术研究,共赢全球投资机会公众号:BTC交易公子扶苏

免责声明:本文章仅代表作者个人观点,不代表本平台的立场和观点。本文章仅供信息分享,不构成对任何人的任何投资建议。用户与作者之间的任何争议,与本平台无关。如网页中刊载的文章或图片涉及侵权,请提供相关的权利证明和身份证明发送邮件到support@aicoin.com,本平台相关工作人员将会进行核查。


