币圈资讯
6月1日热点;
1.SEC 质疑 REX 提交的以太坊与 Solana 质押型 ETF 合法性
2.IMF 质疑巴基斯坦比特币挖矿电力计划,要求紧急澄清合法性
3.慢雾余弦:以太坊新机制 EIP-7702 的最大使用者为盗币团伙
4.欧盟委员会发言人:欧盟已准备好对美国提高关税采取反制措施
5.Michael Saylor 称比特币资产负债表策略全球爆发,华尔街仍持怀疑态度
交易心得
被套看跌别瞎折腾!这6件事别碰确定行情向下就果断止损!别做这些无用功:1. 死盯K线找支撑,越看越陷情绪怪圈2. 翻遍利好博文自我安慰,幻想救不了跌势3. 泡社群和套友互喊“登月”,集体麻痹更危险4. 刷推搜币名找“看涨观点”,只会被杂音干扰5. 跪求大佬点评,他人判断不如自己果断6. 焦虑破防变“黑子”,情绪化操作最伤本金
及时止损不是认怂,是留实力等下一波!
LIFE IS LIKE
A JOURNEY ▲
下方是大白社区本周实盘群单子,恭喜跟上的币友,如果你操作不顺,可以来试试水。
数据真实,每一单都有当时发出的截图。
搜索公众号:大白论币
BTC
分析
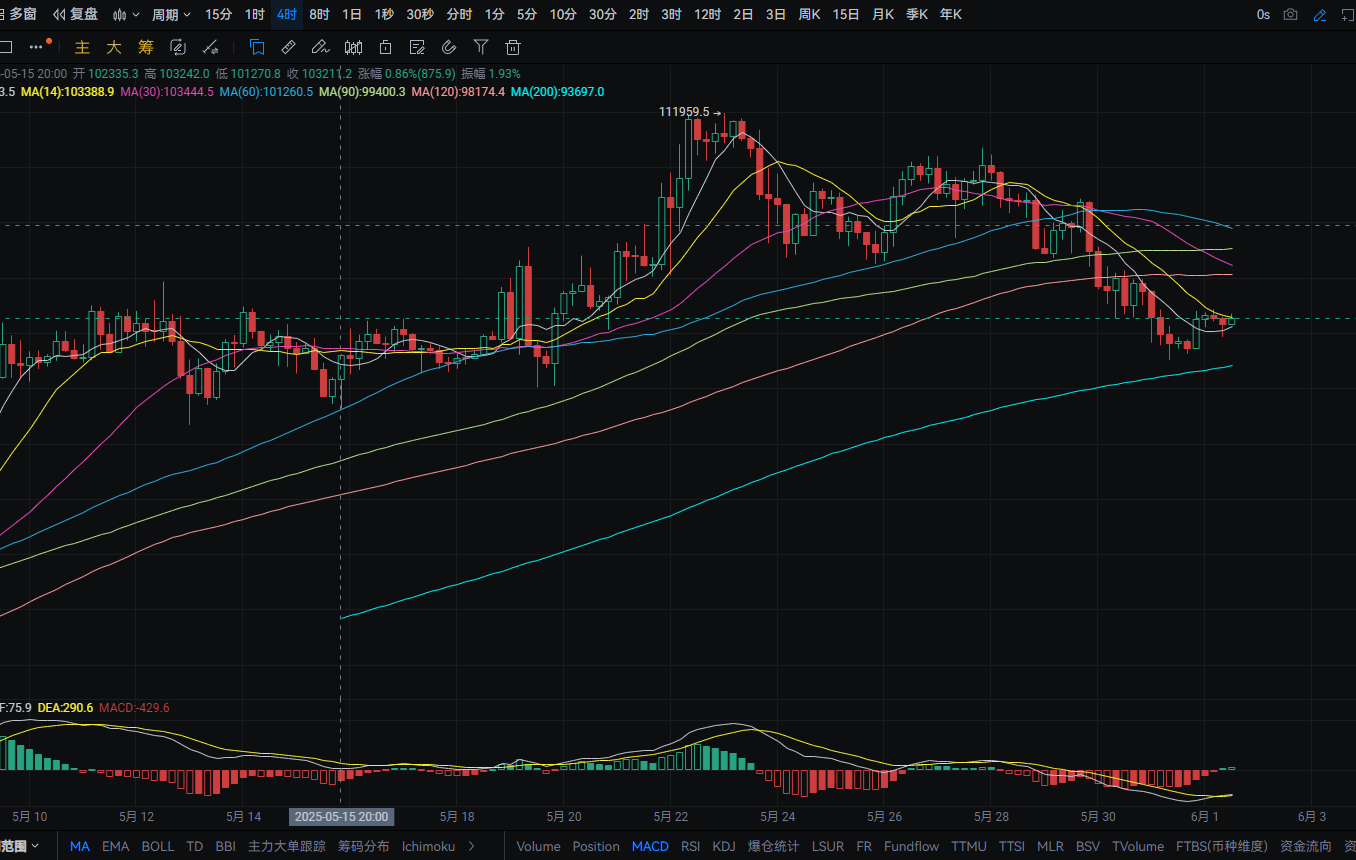
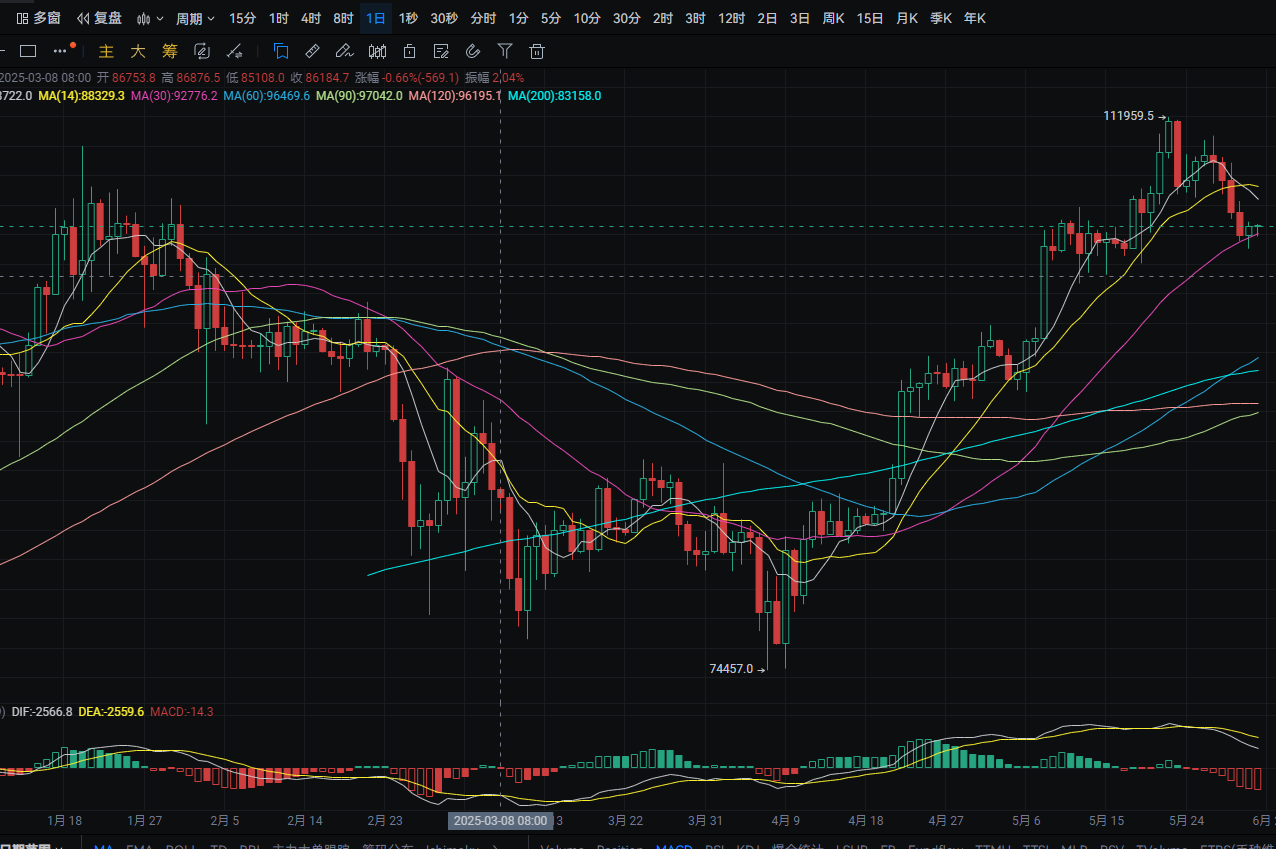
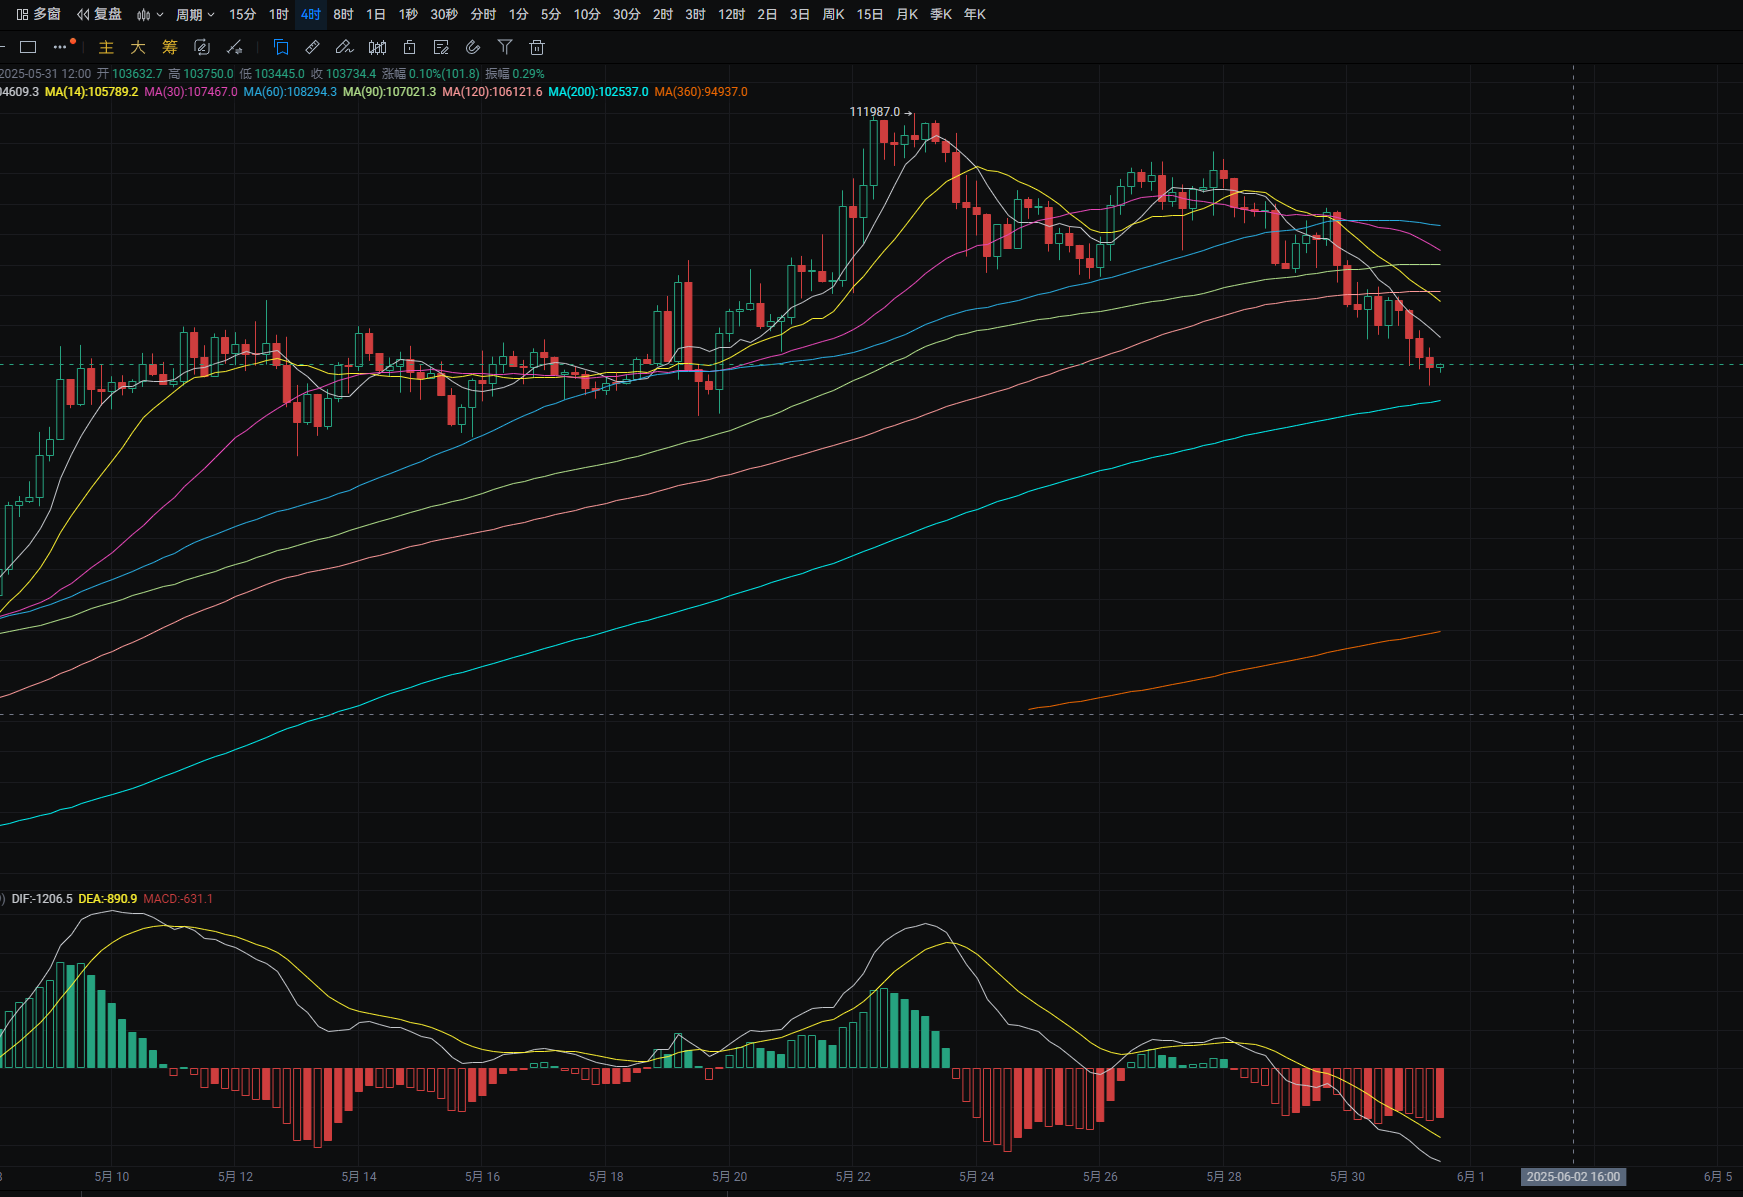
大饼日线昨日从最低103050上涨至最高104900附近 收线在104550附近 下方支撑位于103050附近 跌破则可看至102000附近 回踩可在附近进行接多 上方压力位于MA7均线附近 突破则可看至107750附近 反弹至附近可进行接空 MACD空头增量 四小时下方支持位于103650附近 跌破则可看至MA200附近 回踩可在附近进行接多上方压力位于MA120附近 突破则可看至MA90附近 反弹至附近可进行接空 MACD多头增量 有形成金叉的迹象
ETH
分析
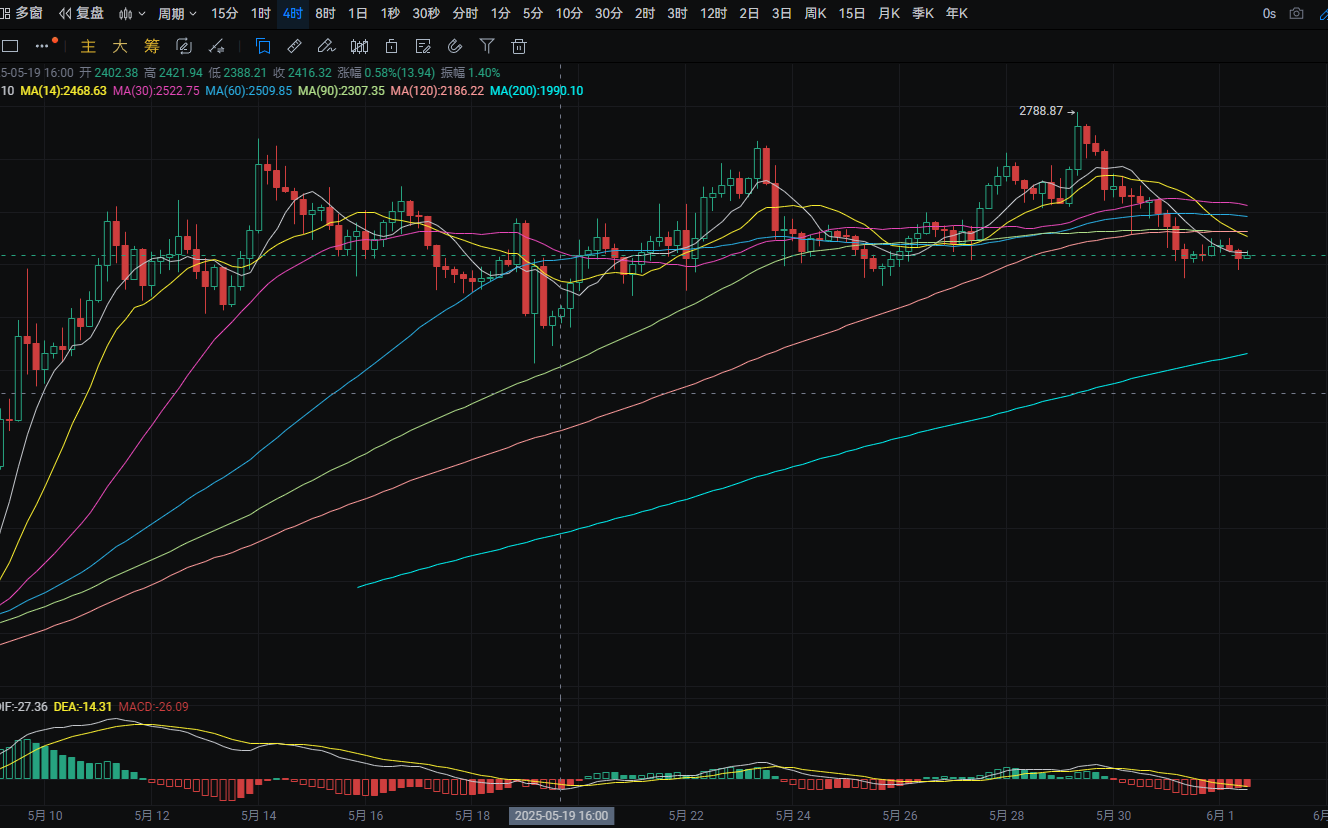
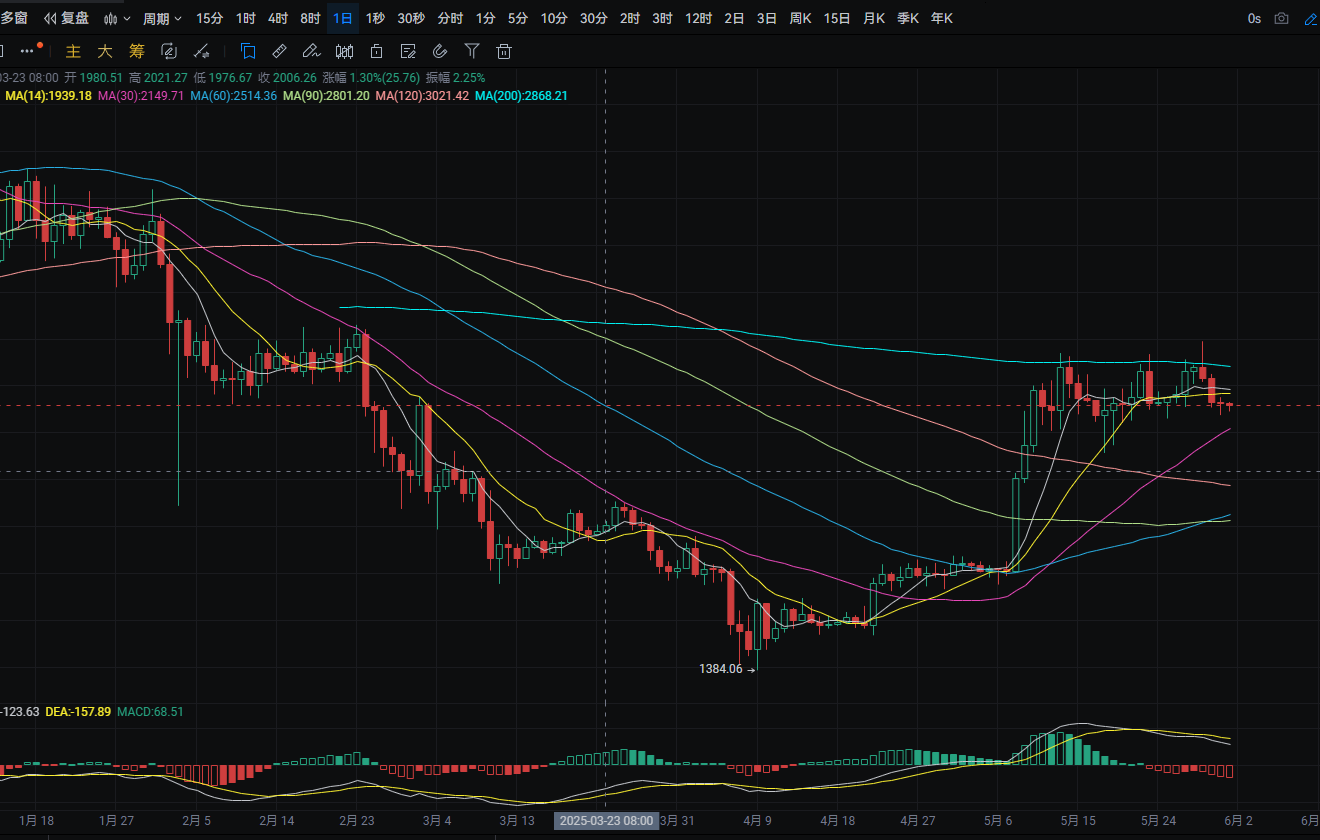
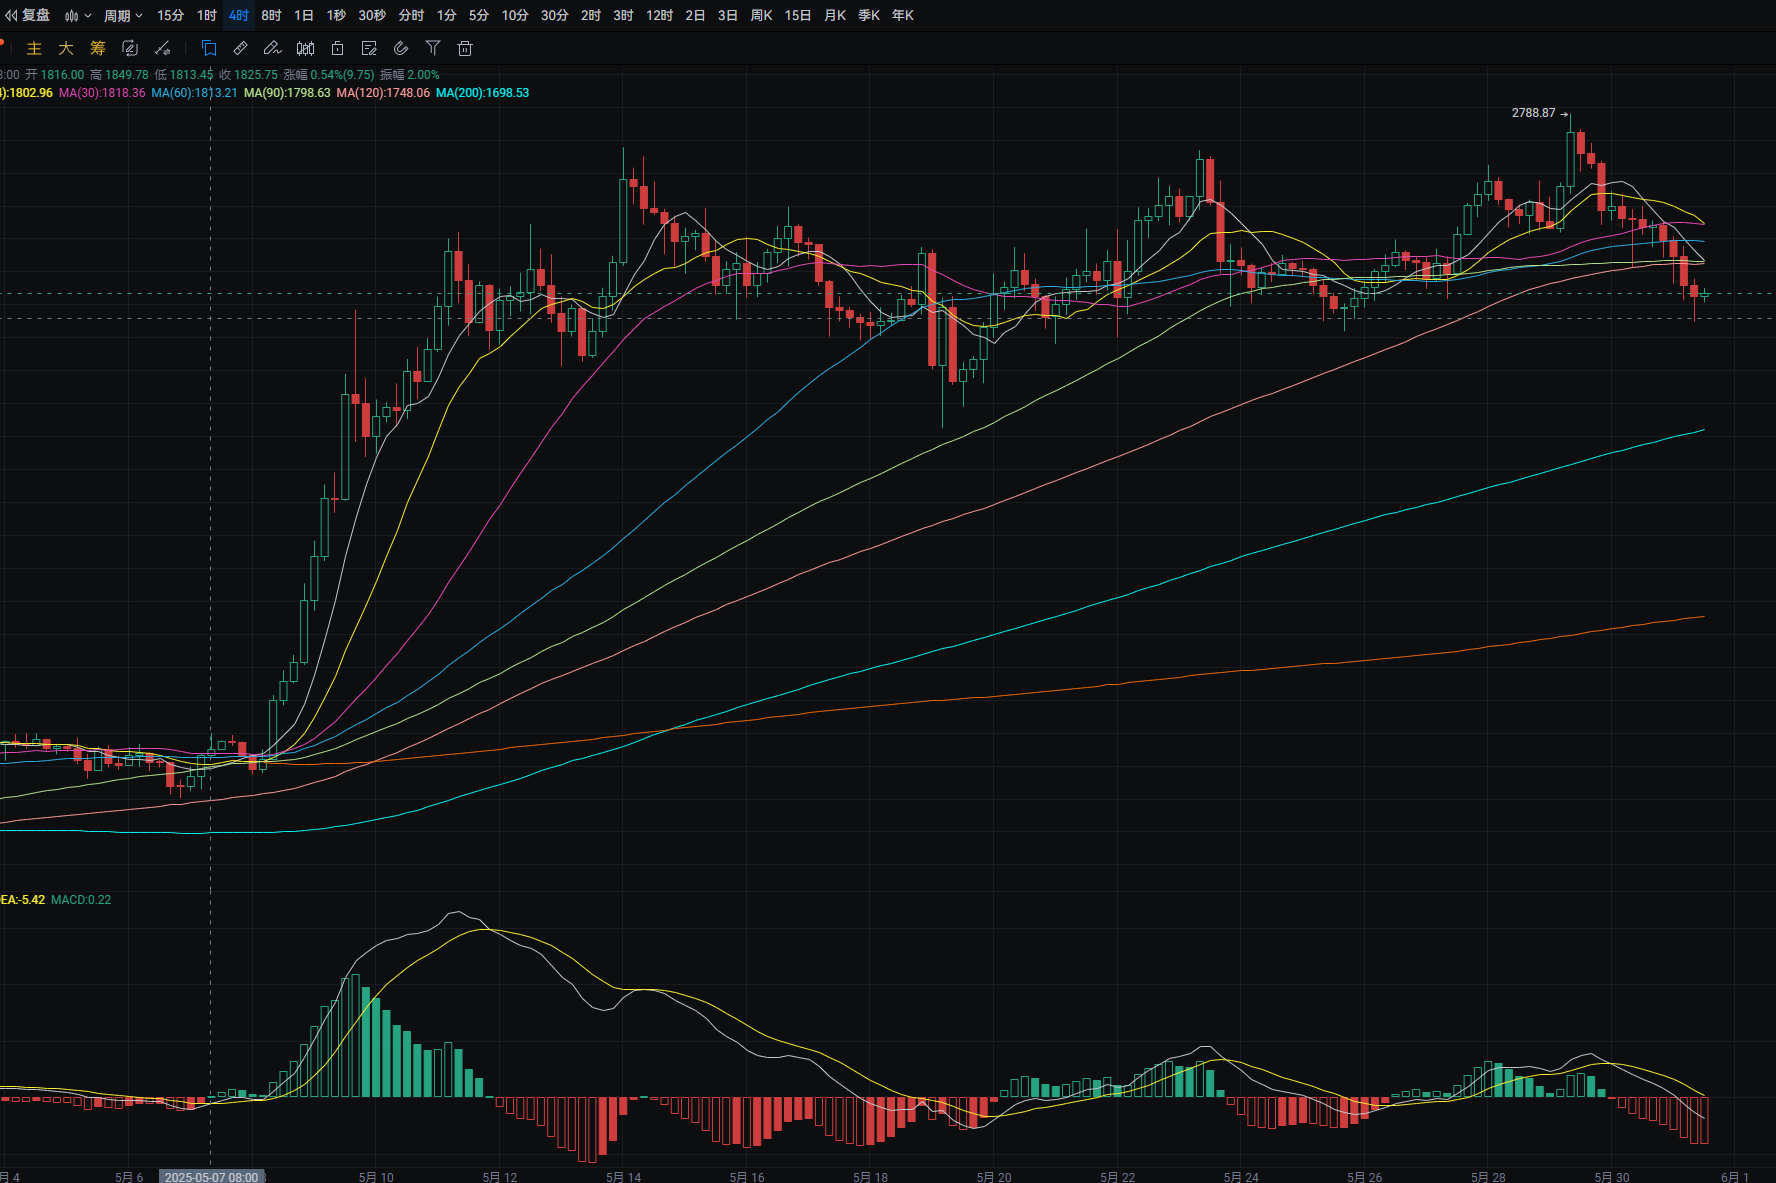
以太日线昨日从最高2550附近下跌至最低2475附近 收线在2525附近 下方支撑位于2475附近 跌破则可看至MA30附近 回踩可在附近进行接多 上方压力位于MA7均线附近 突破则可看至MA200附近 反弹至附近可进行接空 MACD空头增量 四小时下方支撑位于2490附近 跌破则可看至2450附近 回踩可在附近进行接多 上方压力位于MA120附近 突破则可看至MA60附近 反弹至附近可进行接空 MACD空头缩量
免责声明:以上内容均为个人观点,仅供参考!不构成具体操作建议,也不负法律责任。市场行情瞬息万变,文章具有一定滞后性,如果有什么不懂的地方,欢迎咨询
5月31日热点;
1.SharpLink Gaming 提交 10 亿美元 S-3 ASR 注册,拟将募集资金用于增持 ETH
2.Trump 拟将钢铁关税提高至 50%,为支持 US Steel 与新日铁交易提供政治保障
3.BitMEX 拦截 Lazarus 攻击,暴露其分裂结构与安全漏洞
4.Trump Media 完成私募融资,23.2 亿美元将用于购入比特币
5.美法官驳回辩方请求,拒绝命令 DOJ 重新审查 Roman Storm 案证据
交易心得
币圈多年,总结了8个结合“量”的交易技巧,对你一定有帮助! 1、底部缩量不跌——主力吸筹信号 ①原理:底部区域量缩价稳,抛压弱,筹码锁定强,主力悄然吸筹。②应用:关注不急于入,待放量上涨再介入。 2、高位放量不涨——主力出货警报 ①原理:高位量增价滞,大量筹码抛出,主力借高量出货。②应用:持股者警惕,考虑减仓或离场。 3、增量上涨——涨势延续密码 ①原理:上涨时量增,新资金涌入,多方强,股价有上升动力。②应用:顺势操作,回调量未缩可加仓或持有。 4、缩量下跌——筑底进行时 ①原理:下跌量缩,抛售意愿弱,空方力竭,接近底部。②应用:勿盲目割肉,等底部确认信号再决策。 5、急跌慢涨——支撑位做多契机 ①原理:急跌后慢涨,恐慌盘出,多方修复,支撑位获支撑可做多。②应用:支撑位设止损,逢低买,目标看前期高点。 6、急涨慢跌——压力位做空时机 ①原理:急涨后慢跌,多方力竭,压力位遇阻回落可做空。②应用:压力位设止损,逢高卖,目标看下方支撑位。 7、放量上涨——回调预警 ①原理:放量大涨后,获利和解套盘抛压大,币价需回调消化。②应用:适当减仓锁定利润,等回调后再介入。 8、放量下跌——反弹在望 ①原理:放量暴跌恐慌盘出,情绪释放后空方力竭,易反弹。②应用:激进者等止跌信号,轻仓博反弹,设好止损。
LIFE IS LIKE
A JOURNEY ▲
下方是大白社区本周实盘群单子,恭喜跟上的币友,如果你操作不顺,可以来试试水。
数据真实,每一单都有当时发出的截图。
搜索公众号:大白论币
BTC
分析
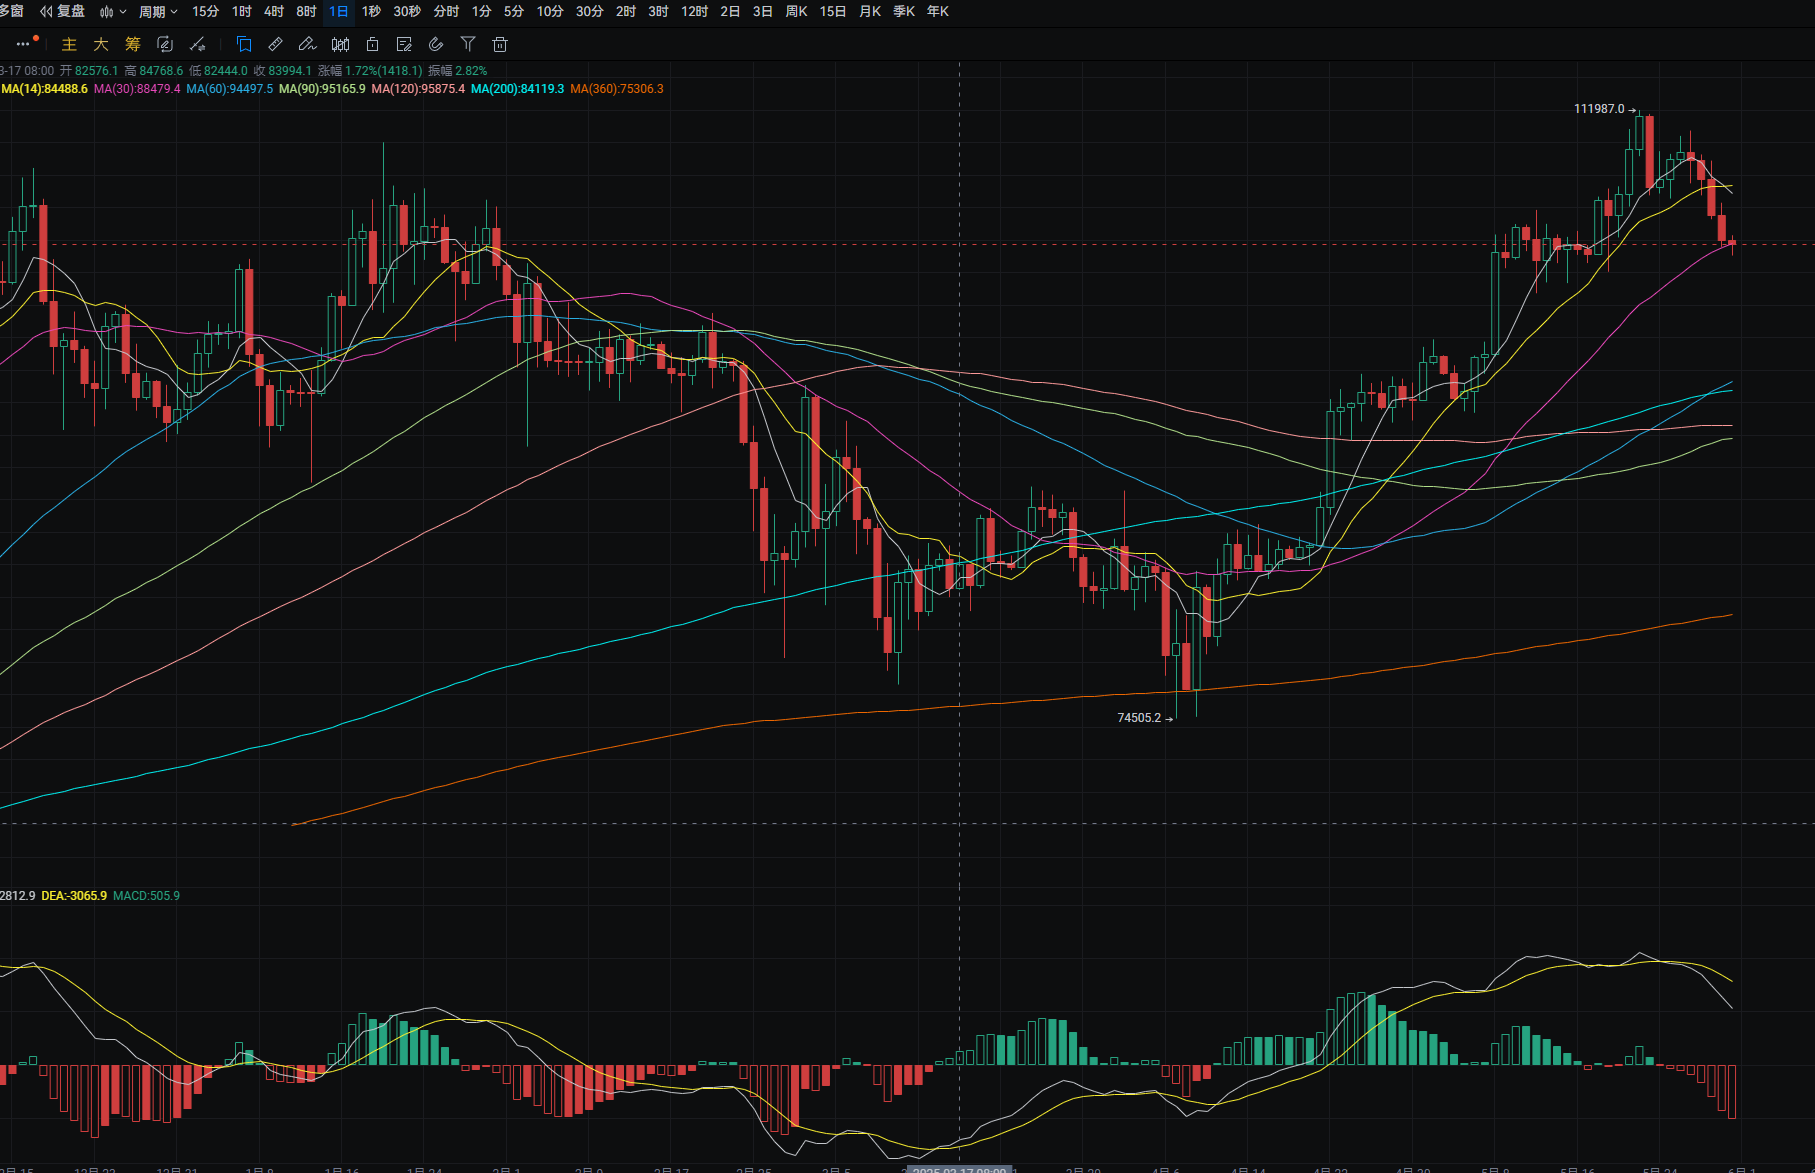
大饼日线昨日从最高106300附近下跌至最低103550附近 收线在103950附近 下方支撑位于102350附近 跌破则可看至101450附近 回踩可在附近进行接多 上方压力位于105500附近 突破则可看至MA7均线附近 MACD空头增量 四小时下方支撑位于MA200附近 回踩可在附近进行接多 上方压力位于MA7均线附近 突破则可看至MA120附近 MACD空头增量
ETH
分析
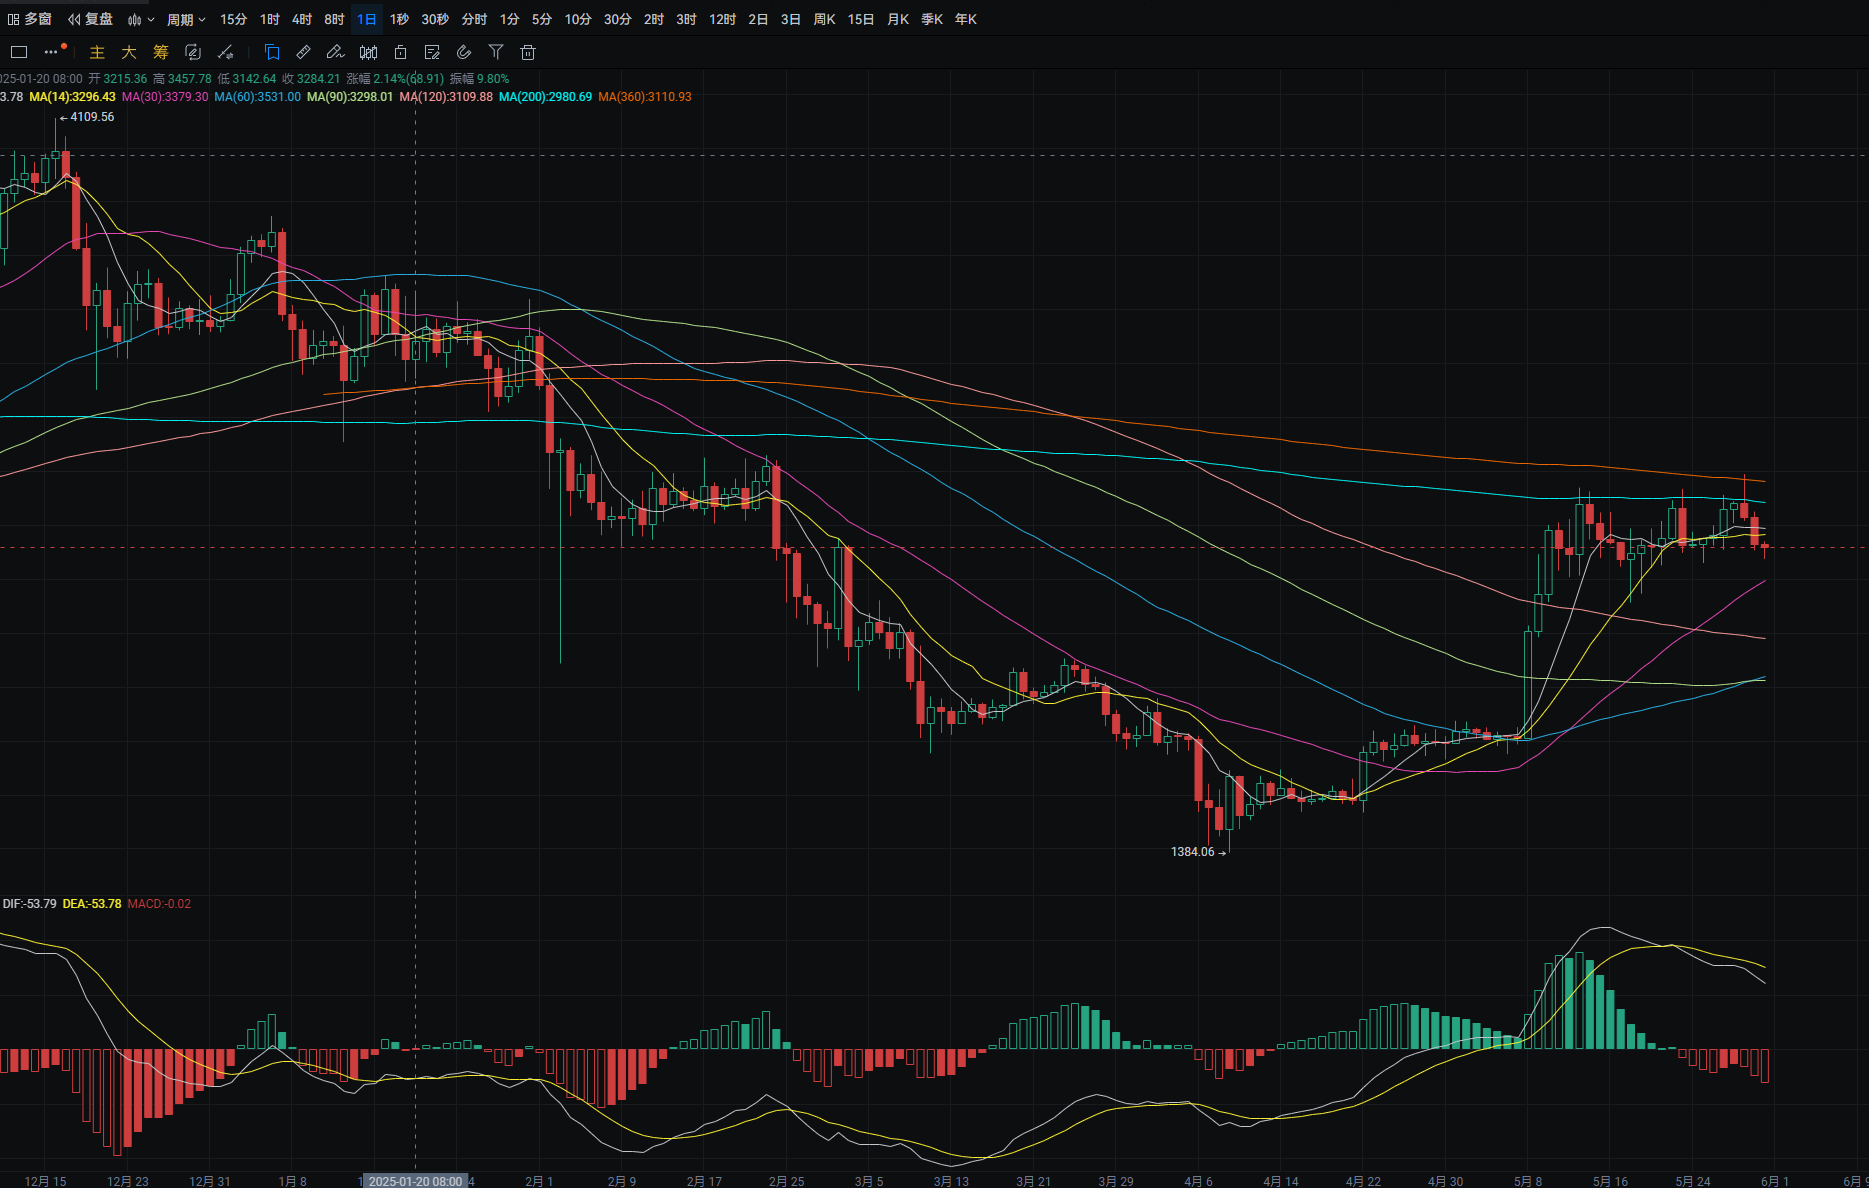
以太日线昨日从最高2650附近下跌至最低2505附近 收线在2530附近 下方支撑位于2450附近 跌破则可看至MA30附近 回踩可在附近进行接多 上方压力位于MA7均线附近 突破则可看至MA200附近 反弹至附近可进行接空 MACD空头增量 四小时下方支撑位于2475附近 跌破则可看至2435附近 回踩可在附近进行接多 上方压力位于MA120附近 突破则可看至MA30附近 MACD空头增量 形成死叉
免责声明:以上内容均为个人观点,仅供参考!不构成具体操作建议,也不负法律责任。市场行情瞬息万变,文章具有一定滞后性,如果有什么不懂的地方,欢迎咨询
免责声明:本文章仅代表作者个人观点,不代表本平台的立场和观点。本文章仅供信息分享,不构成对任何人的任何投资建议。用户与作者之间的任何争议,与本平台无关。如网页中刊载的文章或图片涉及侵权,请提供相关的权利证明和身份证明发送邮件到support@aicoin.com,本平台相关工作人员将会进行核查。


