The delay in US-China tariffs exceeded expectations, the US dollar surged, and interest rate cuts may restart soon (05.12~05.18)

CN
4 hours ago

The information, opinions, and judgments regarding the market, projects, currencies, etc., mentioned in this report are for reference only and do not constitute any investment advice.

US-China Tariff Suspension Exceeds Expectations, US Dollar Surges, Rate Cuts May Restart Soon (05.12~05.18)

The first contact between the US and China in Switzerland led to significant results, marking major progress in the third phase of the "reciprocal tariff war."

The US stock and cryptocurrency markets quickly eliminated the negative pricing of the "reciprocal tariff war," with the speed and magnitude exceeding expectations.

Market traders began to trade under a new paradigm—whether the US economy and employment will face a recession and the Federal Reserve's appropriate timing to restart rate cuts.

The inflation and employment data released this week indicate that inflation continues to decline, and employment remains temporarily stable—the impact of the reciprocal tariffs is lower than expected.

After the unexpected data input into the new trading framework, US stock indices surged significantly throughout the week, while gold plummeted.

This week, Federal Reserve Chairman Powell mentioned in an important speech the need to reassess the "monetary policy framework," which may prompt a rapid restart of the rate-cutting cycle. However, Fitch's downgrade of US Treasury bonds from Aaa to Aa1 further indicates that the long-term crisis of US Treasury bonds is increasingly looming.

Policy, Macro Finance, and Economic Data

The biggest variable in the financial market in recent months, the "reciprocal tariff war," underwent a significant change on May 12. After the US and China met in Switzerland, a 90-day temporary tariff reduction agreement was announced. The US will reduce tariffs on Chinese goods from a maximum of 145% to 30%, which includes a 20% "fentanyl tariff" and a 10% base tariff. China will reduce tariffs on US goods from a maximum of 125% to 10% and suspend or cancel non-tariff countermeasures implemented since April, such as restrictions on rare earth exports.

Previously, we pointed out that the tariff war had entered the third phase. This preliminary agreement between the US and China signifies significant progress in the third phase. Coupled with Trump's subsequent announcement that he could not negotiate with 150 countries one by one, we tend to judge that the impact of the tariff war is gradually passing, and the final outcome may not have an unexpected impact on the global economy in the short term.

This should be the reason why US stock traders were bullish throughout the week, rapidly pushing the three major indices significantly higher. For the week, the Nasdaq, S&P 500, and Dow Jones indices rose by 7.15%, 5.27%, and 3.41%, respectively, achieving four consecutive weeks of gains. If rate cut expectations rise, it may break historical highs in the short term.

This week, the US released April CPI data, with a seasonally adjusted CPI month-on-month rate of 2.3%, lower than expected, marking a decline for three consecutive months. On the 15th, employment data showed that initial jobless claims were 229,000, in line with expectations. The PPI, which reflects corporate trends, was 2.4%, slightly below expectations. Multiple data points indicate that the tariff war has not yet caused hard data damage to consumption, and with inflation declining, restarting rate cuts is becoming the best option.

In his speech this week, Powell stated that the monetary policy framework introduced in 2020 (centered on a 2% average inflation target, allowing for moderate overshooting of inflation to support employment) is no longer fully applicable in the current economic environment. He mentioned that frequent supply shocks (such as the tariff war and supply chain issues) make it difficult for the average inflation target system to respond, necessitating policy adjustments to better balance inflation and employment goals. In the framework used by the Federal Reserve in recent years, actions are often taken when the CPI average over a certain period approaches 2%. The mention of reassessing may prompt actions based on shorter time frames or even monthly CPI data. This will undoubtedly enhance its flexibility to respond to data fluctuations caused by frequent policy adjustments from the Trump administration. Under the new framework, the current CPI data is already very close to the requirements for rate cuts.

The Federal Reserve's reiteration of the monetary policy framework may also have deeper underlying reasons, namely the US debt issue. As US stocks rose, the yields on 2-year and 10-year US Treasury bonds rebounded again this week, reaching highs of 4.0140 and 4.4840, respectively.

According to analysis, the US is adding $1.9 trillion in debt this year, while the scale of debt maturing and needing to be refinanced this year may reach $9.2 trillion, with $6.5 trillion due in June alone. If rate cuts are not initiated soon, not only will the US government continue to bear high interest costs, but it may also face auction difficulties in the primary market. As a "gray rhino," the massive debt will continue to trouble the US government and become the most important variable affecting its political, economic, and financial policies. We judge that the Federal Reserve's adjustment of the monetary framework is fundamentally driven by debt and the potential crisis it may trigger.

On May 16, rating agency Moody's downgraded the US government's long-term issuer and senior unsecured debt rating from Aaa to Aa1. This is the first downgrade of the US Treasury rating by Moody's since 1917 and marks the loss of the highest credit rating from all three major rating agencies (S&P, Fitch, and Moody's). Previously, S&P downgraded the US rating to AA+ in 2011, and Fitch did so in 2023, both equivalent to Aa1.

The debt "gray rhino" has become the most important indicator affecting US interest rates and the stability of financial markets in the medium to long term.

Cryptocurrency Market

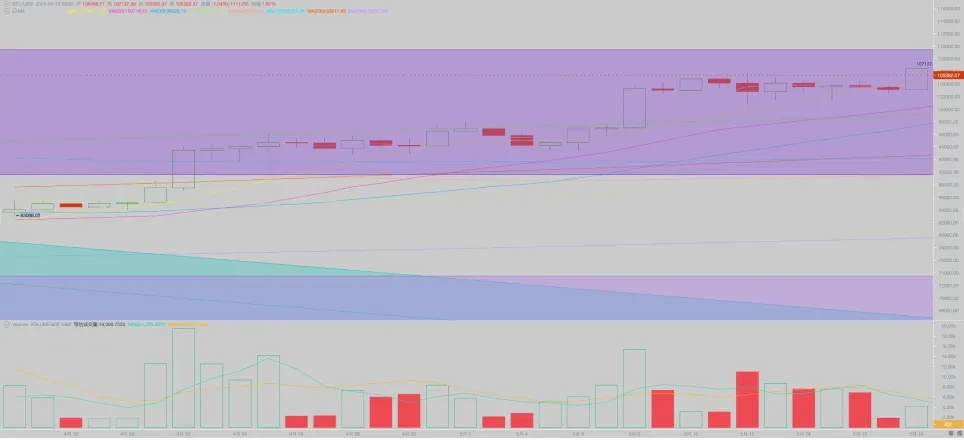
Previously, BTC led the US stock market in clearing the pricing of the "reciprocal tariff war," approaching previous highs. After the significant rise in the US stock market this week, it maintained a high-level consolidation for most of the time, and by Sunday, it suddenly surged to $106,692.97, ultimately closing the week up 2.24%.

From a technical perspective, it operated above the "first upward trend line" throughout the week, nearing the upper edge of the "Trump bottom." The overbought indicators have seen some correction. Trading volume remained close to last week's levels.

Capital Inflows and Outflows

This week, the entire market maintained relatively strong capital inflows, with two channels seeing inflows of $2.527 billion, including $1.88 billion in stablecoins and a total of $647 million in BTC ETF and ETH ETF.

For four consecutive weeks, capital inflows through the ETF channel have been declining, which is worth noting.

On-chain lending funds are in an expansion phase. The contract market is in the second expansion phase of this round of market conditions.

Selling Pressure and Liquidation

After returning to $100,000, some bottom-fishing funds took profit. With the recovery of liquidity, some long-term holders made small sales. Overall, the phase of "long-term holders reducing positions while short-term holders increasing positions" has not fully opened, as long-term buyers under more pressure are expecting higher prices.

US-China Tariff Suspension Exceeds Expectations, US Dollar Surges, Rate Cuts May Restart Soon (05.12~05.18)

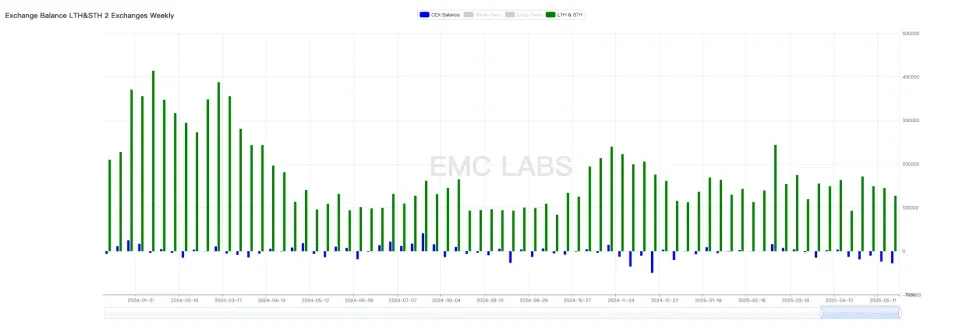
Centralized cryptocurrency exchange BTC inflow and outflow statistics

In terms of reduction scale, the BTC inflow to exchanges this week was 127,226 coins, marking a continuous decline for four weeks, while the outflow from exchanges reached 27,965 coins, the highest this year. The reduction in selling scale and the increase in buying scale often indicate a rapid price increase in the future when external conditions are favorable.

Cycle Indicators

According to eMerge Engine, the EMC BTC Cycle Metrics indicator is at 0.875, indicating an upward phase.

About EMC Labs

EMC Labs was established in April 2023 by cryptocurrency asset investors and data scientists. It focuses on blockchain industry research and investments in the crypto secondary market, with industry foresight, insights, and data mining as its core competitiveness, aiming to participate in the thriving blockchain industry through research and investment, promoting the benefits of blockchain and crypto assets for humanity.

For more information, please visit: https://www.emc.fund

免责声明:本文章仅代表作者个人观点,不代表本平台的立场和观点。本文章仅供信息分享,不构成对任何人的任何投资建议。用户与作者之间的任何争议,与本平台无关。如网页中刊载的文章或图片涉及侵权,请提供相关的权利证明和身份证明发送邮件到support@aicoin.com,本平台相关工作人员将会进行核查。

注册返10%、领$600,前100名赠送PRO会员
链接:https://accounts.suitechsui.blue/zh-CN/register?ref=FRV6ZPAF&return_to=aHR0cHM6Ly93d3cuc3VpdGVjaHN1aS5hY2FkZW15L3poLUNOL2pvaW4_cmVmPUZSVjZaUEFG
Ad
Share To
APP

X

Telegram

Facebook

Reddit

CopyLink