原文标题:《10.6 万美元成「死亡分界」?中美握手言和,比特币为何上演高台跳水》
原文作者:Lawrence,火星财经
一、协议落地:风险偏好转移下的「跷跷板效应」
北京时间 5 月 12 日,中美两国在日内瓦达成的关税休战协议,为持续数年的贸易摩擦按下「暂停键」。协议内容包括暂停 24% 的互征关税 90 天,保留 10% 基础税率,并建立第三国协商机制。这一进展直接刺激标普 500 指数期货跳涨 3%,纳斯达克收涨 4.35%。但比特币却在触及 105,720 美元后意外回落至最低 100700 美元,形成「股币背离」的罕见格局,截至发稿 BTC 已回升至 102600 美元。
· 数据透视:
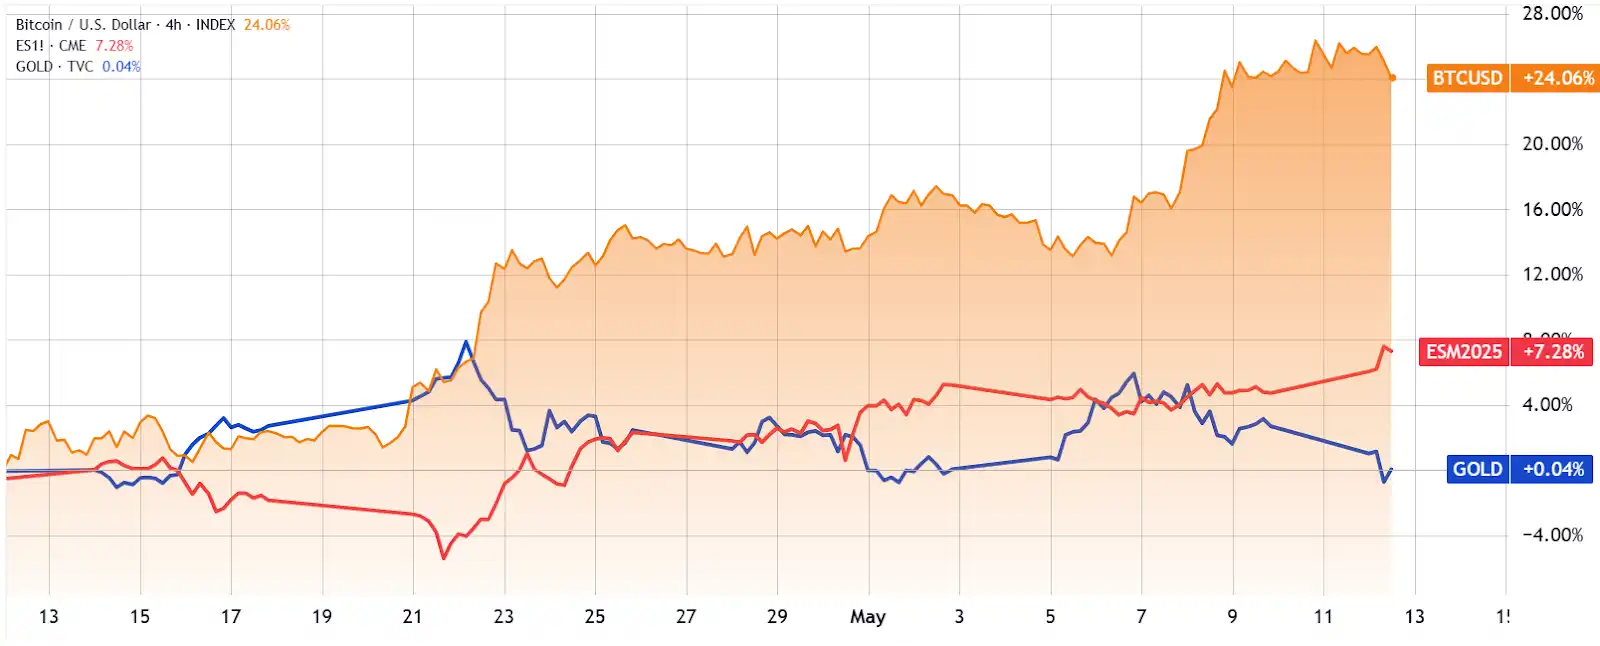
比特币/美元(橙色)对比标准普尔 500 指数期货(红色)和黄金(蓝色)。资料来源:TradingView
· 短期资金分流: 过去 30 天,比特币累计上涨 24%,而同期标普 500 涨幅仅 7%,黄金价格持平。随着贸易协议降低市场不确定性,部分资金从加密资产回流传统股市,导致比特币与传统市场的 30 天相关性升至 83% 的历史高位 1。
· 机构持仓「双刃剑」: MicroStrategy 及其关联机构近期增持 13,390 枚 BTC,总持仓达 119 万枚(占流通量 6%)。尽管这被视为长期利好,但市场担忧其集中持仓可能形成「价格操控」风险,尤其当平均成本攀升至 10 万美元以上时,短期抛压预期升温。
二、技术面博弈:106,000 美元成「多空分水岭」
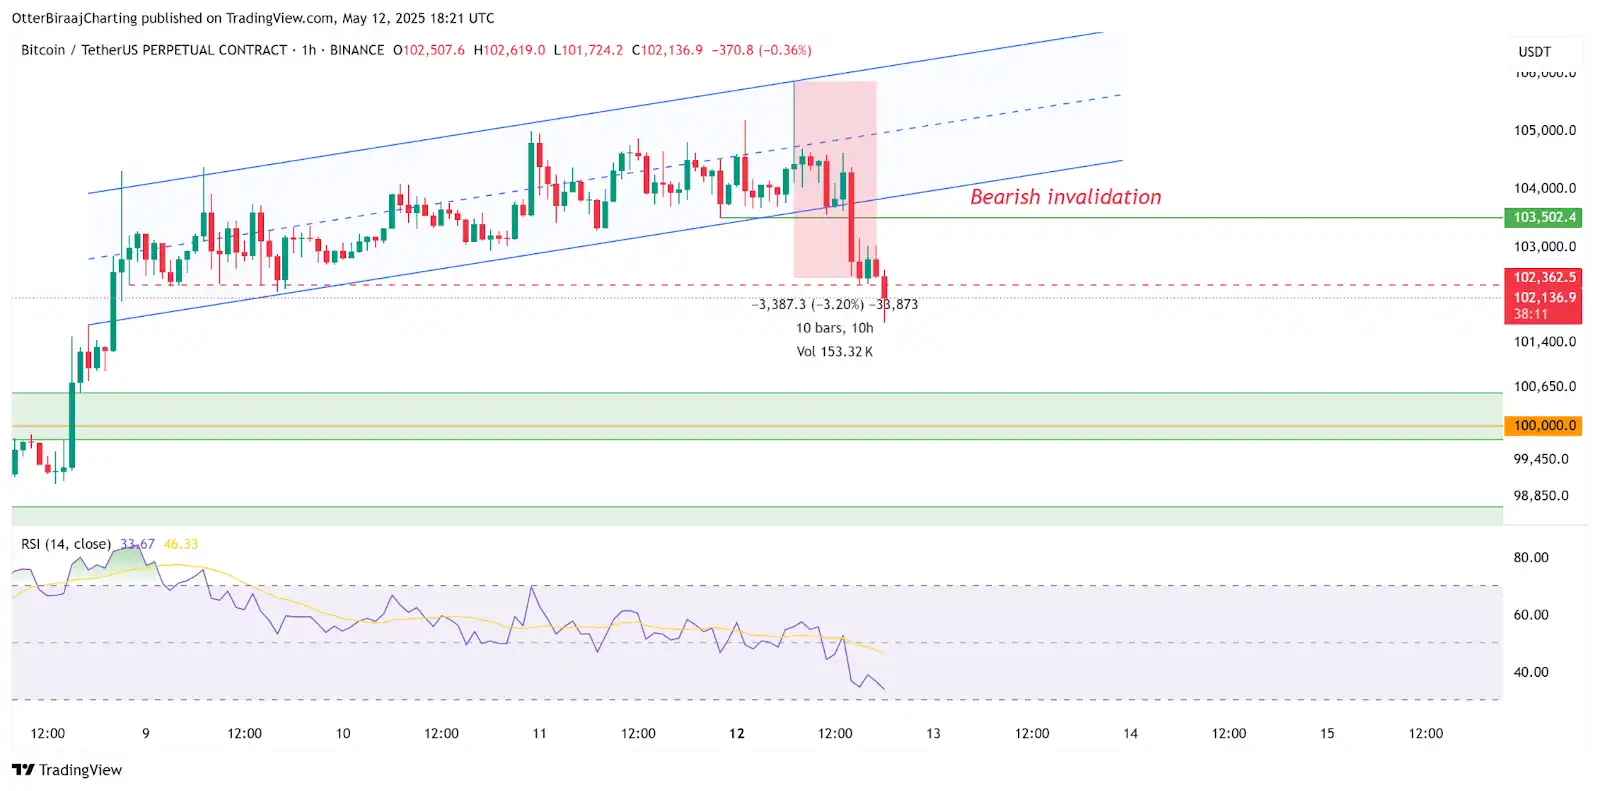
5 月 12 日,比特币短暂突破 105,800 美元后迅速回落至 101,400 美元,1 小时 K 线图显示价格跌破上升通道下沿。
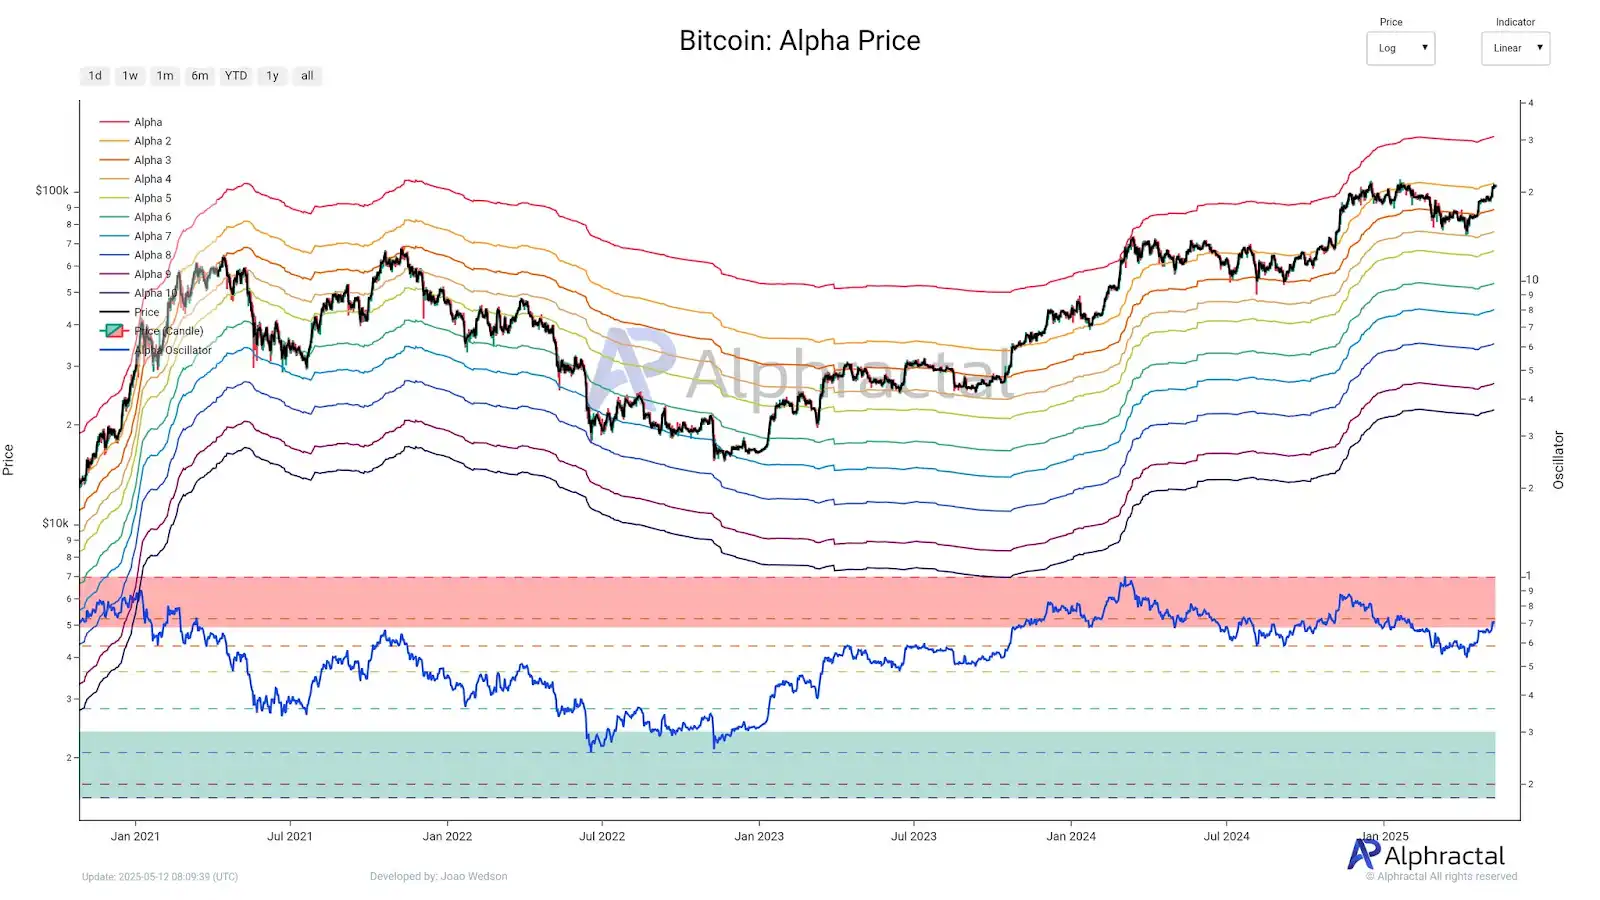
比特币 Alpha 价格水平。资料来源:X.com
Alphractal 首席执行官 Joao Wedson 指出,106,000 美元附近存在「Alpha 价格」阻力区,长期持有者可能在此位置触发获利了结。
· 关键风险指标:
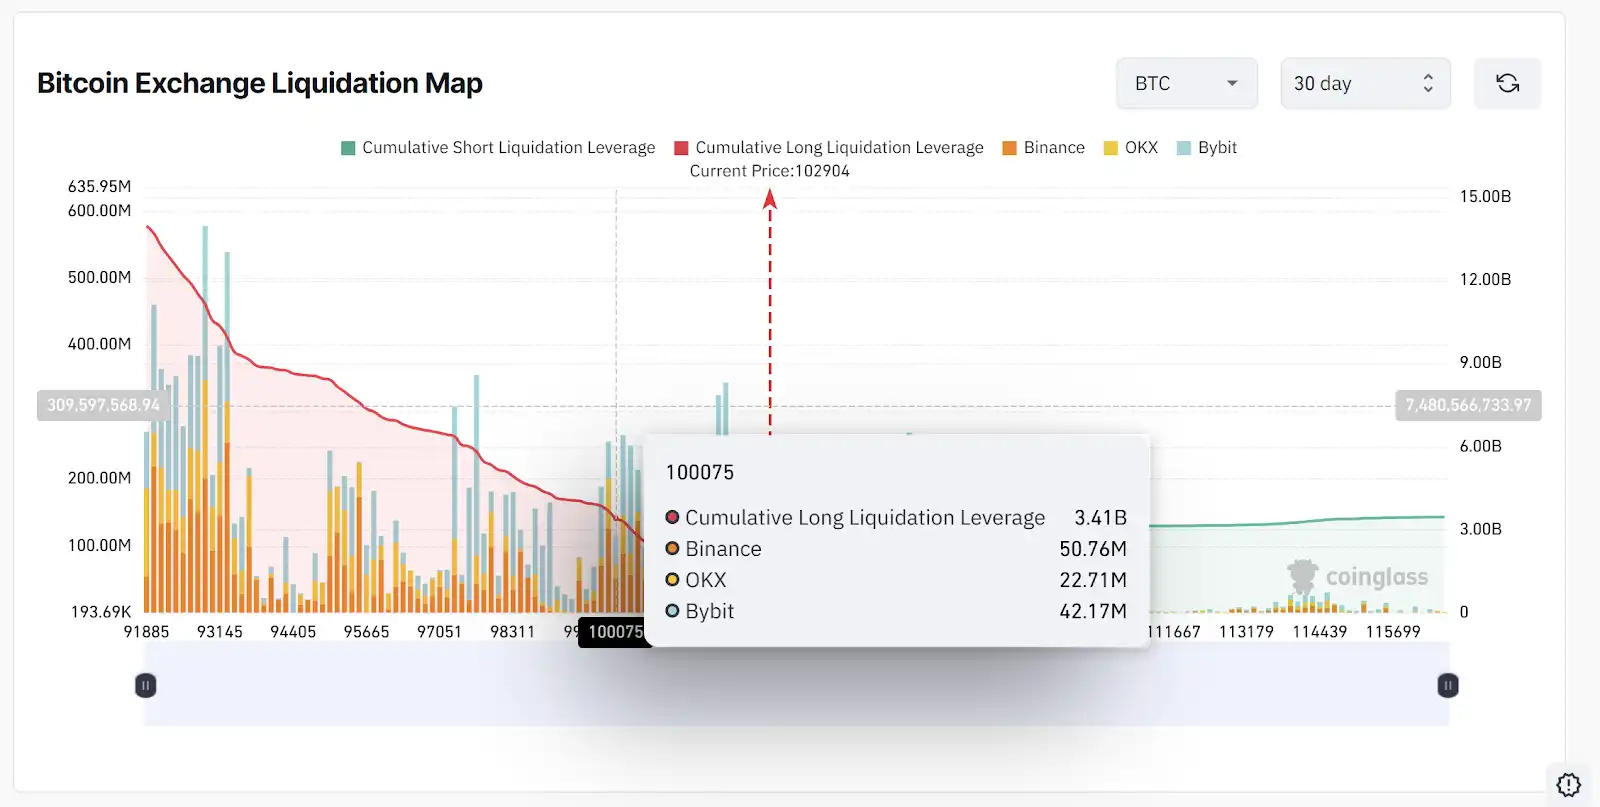
· 清算磁吸效应: CoinGlass 数据显示,若价格跌至 10 万美元,约 34 亿美元的多头杠杆仓位将面临强平风险,形成短期下行压力。
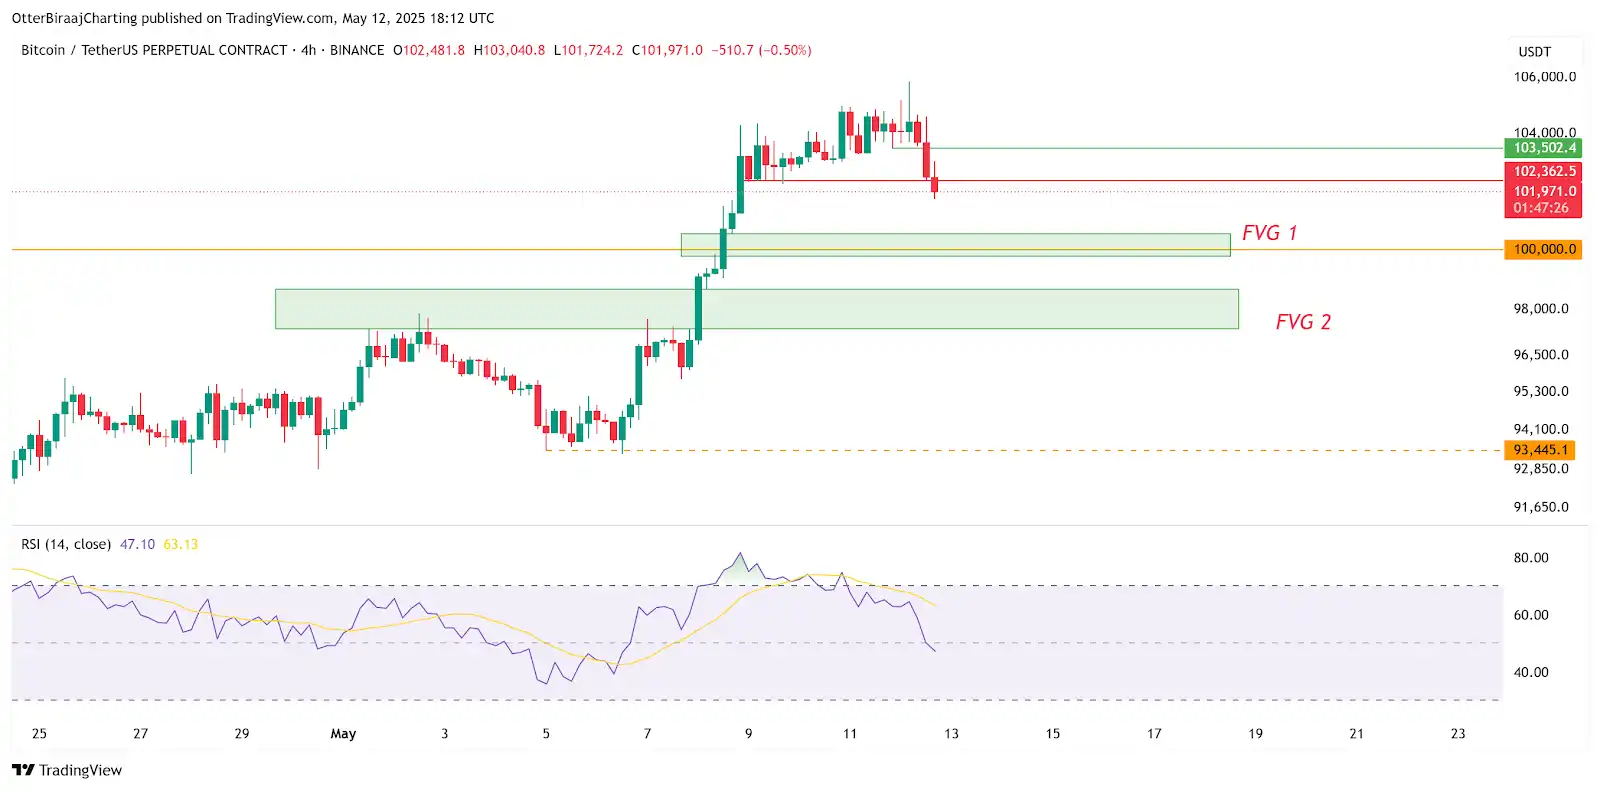
· 支撑区间验证: 四小时图显示,99,700-100,500 美元为近期「公允价值缺口」(FVG),若跌破则可能进一步下探 97,363-98,680 美元区间,回调幅度达 8%。
三、宏观变量:CPI 数据与美元指数的「蝴蝶效应」
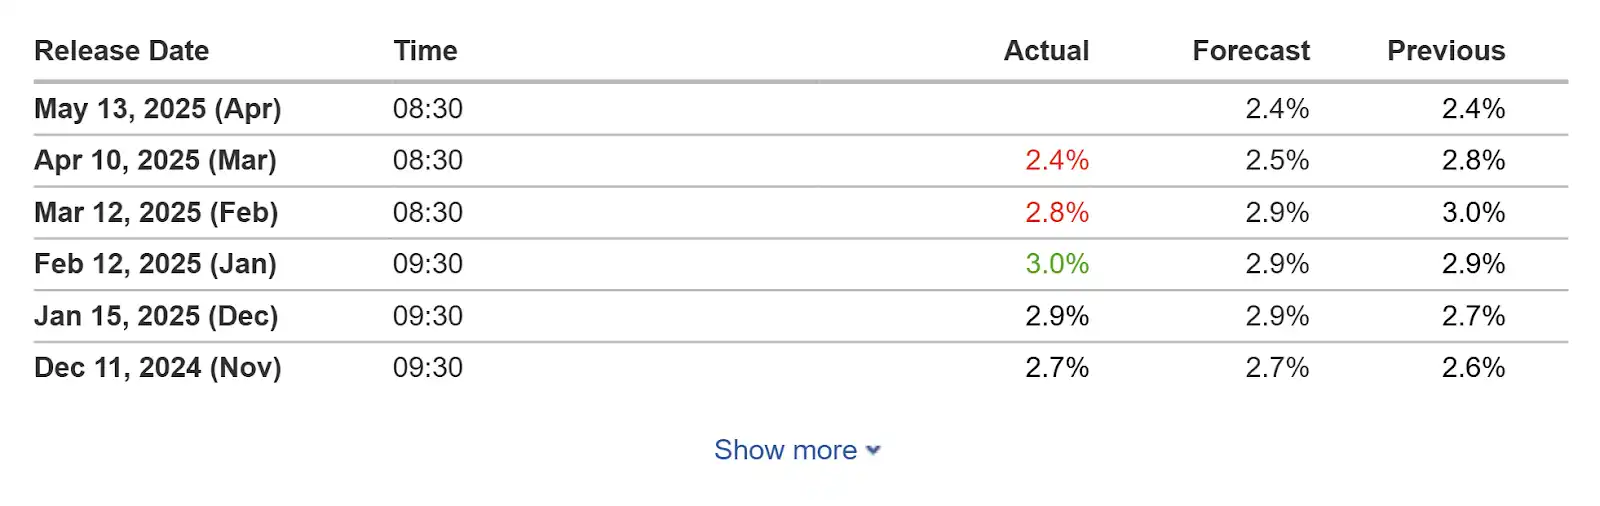
5 月 13 日公布的美国 4 月 CPI 数据成为市场焦点。此前 3 月 CPI 录得 2.4%(低于预期的 2.5%),若 4 月数据延续下行趋势,可能强化美联储降息预期,利好风险资产;反之,若通胀反弹,美元指数(DXY)或突破 30 日高点,对比特币形成压制。
关联性逻辑:
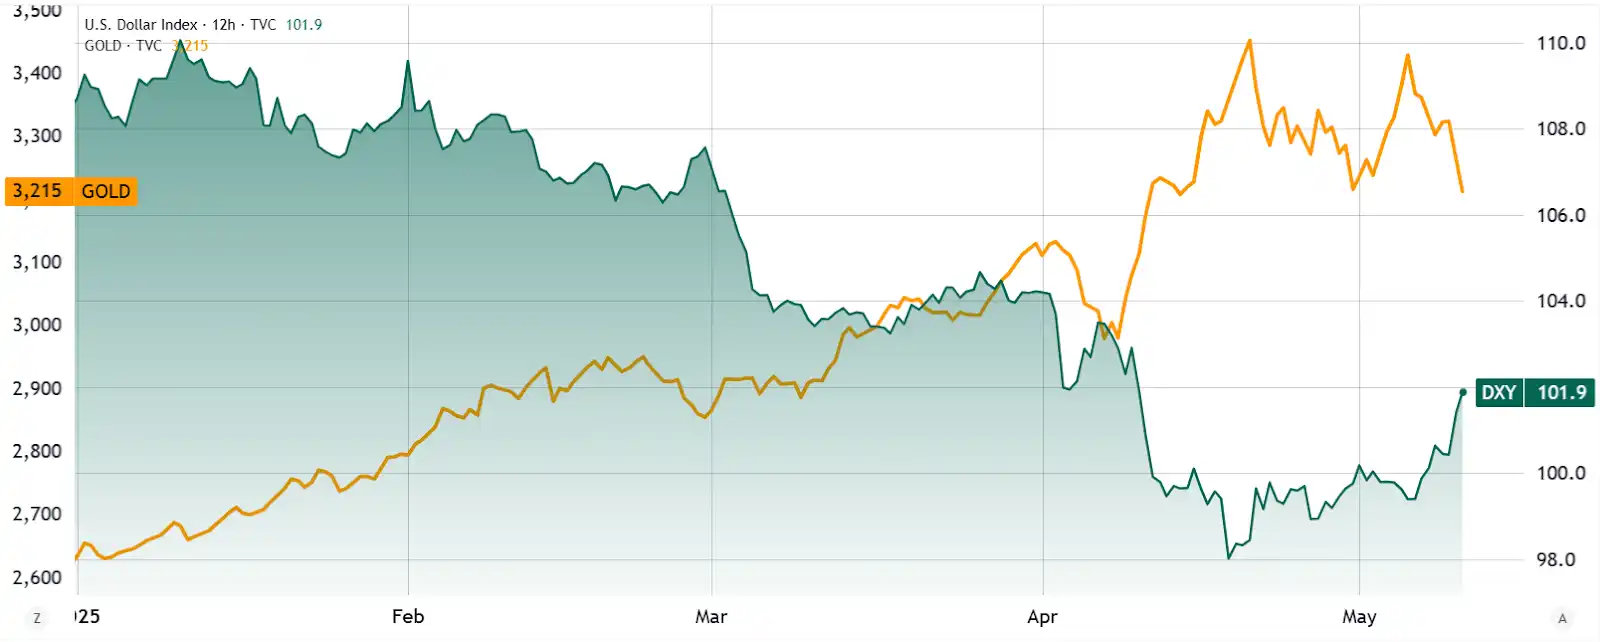
黄金/美元(左)vs 美元指数(右)。来源:TradingView
· 黄金与 BTC 的「避险替代」: 5 月 12 日黄金下跌 3.4%,DXY 攀升至 30 日高位,反映投资者从稀缺资产转向美元及股市。这一轮动验证了比特币与黄金的短期正相关性。
· 美元霸权松动中的长期叙事: 尽管短期受挫,协议中「本币结算试点」条款可能削弱美元贸易结算地位。历史数据显示,2018-2020 年贸易战期间,比特币在初期回调后最终突破 2 万美元,其「去中心化结算工具」属性或在中长期重获关注。
四、市场情绪分化:巨鲸撤退与 ETF 资金流入的「背离信号」
链上数据显示,持仓超 1 万 BTC 的地址数减少 12 个,交易平台储备量下降 1.8%,暗示部分大户选择获利了结。
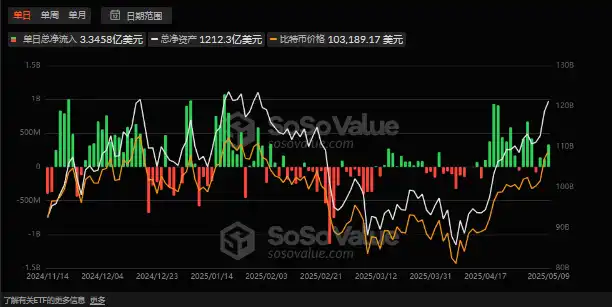
然而,美国现货比特币 ETF 在 5 月 1-9 日净流入 20 亿美元,机构资金仍呈现「越涨越买」态势。
结构性矛盾解析:
· 散户杠杆风险: 当前山寨币交易量激增 280%,但 HTX Research 指出其杠杆率尚处安全区间。相比之下,比特币合约持仓集中于 9.8-10 万美元,易引发「多空双杀」。
· 机构「托底」逻辑: 贝莱德等华尔街巨头通过 ETF 形成流动性垄断,将比特币日波动率从 18% 压缩至 9%,定价权逐步向传统资本倾斜。
五、未来推演:短期震荡与长期范式迁移
· 情景一(乐观):若 CPI 数据低于预期,叠加美联储降息预期升温,比特币或快速修复至 10.5 万美元上方,并冲击 12 万关口。机构增持与 ETF 流入将构筑「护城河」,使跌破 10 万美元的概率低于 20%。
· 情景二(谨慎):若 CPI 反弹引发美元走强,BTC 可能下探 9.7-9.9 万美元支撑位。但 MicroStrategy 的 210 亿美元增资额度为其提供「弹药」,长期持有者抛压有限,回调后或进入 9-11 万美元箱体震荡。
结语:在不确定中寻找确定性
比特币的短期波动,本质是传统金融与加密生态的定价权拉锯。对于投资者而言,需警惕杠杆风险与政策变量,但更应关注其底层逻辑的演进:当关税壁垒与区块链技术碰撞,比特币正从「数字黄金」进化为「跨国价值传输协议」。
比特币的真正胜利,不在于击败法币,而在于证明人类需要多元化的价值锚点。
免责声明:本文章仅代表作者个人观点,不代表本平台的立场和观点。本文章仅供信息分享,不构成对任何人的任何投资建议。用户与作者之间的任何争议,与本平台无关。如网页中刊载的文章或图片涉及侵权,请提供相关的权利证明和身份证明发送邮件到support@aicoin.com,本平台相关工作人员将会进行核查。


