Fundamentals:
The China-U.S. trade negotiations ended positively on Sunday, with a joint statement expected to be reached during the major talks on May 12. This development has boosted market confidence in global economic stability, reducing demand for safe-haven assets like gold. Spot gold opened 2% lower this morning, while U.S. stock index futures opened over 1% higher.
The market capitalization of the stablecoin USDT has reached a historic high, surpassing $150 billion, while Ethereum's market capitalization has exceeded $300 billion, rising to 39th place in the global asset market capitalization rankings.
Technical Analysis:
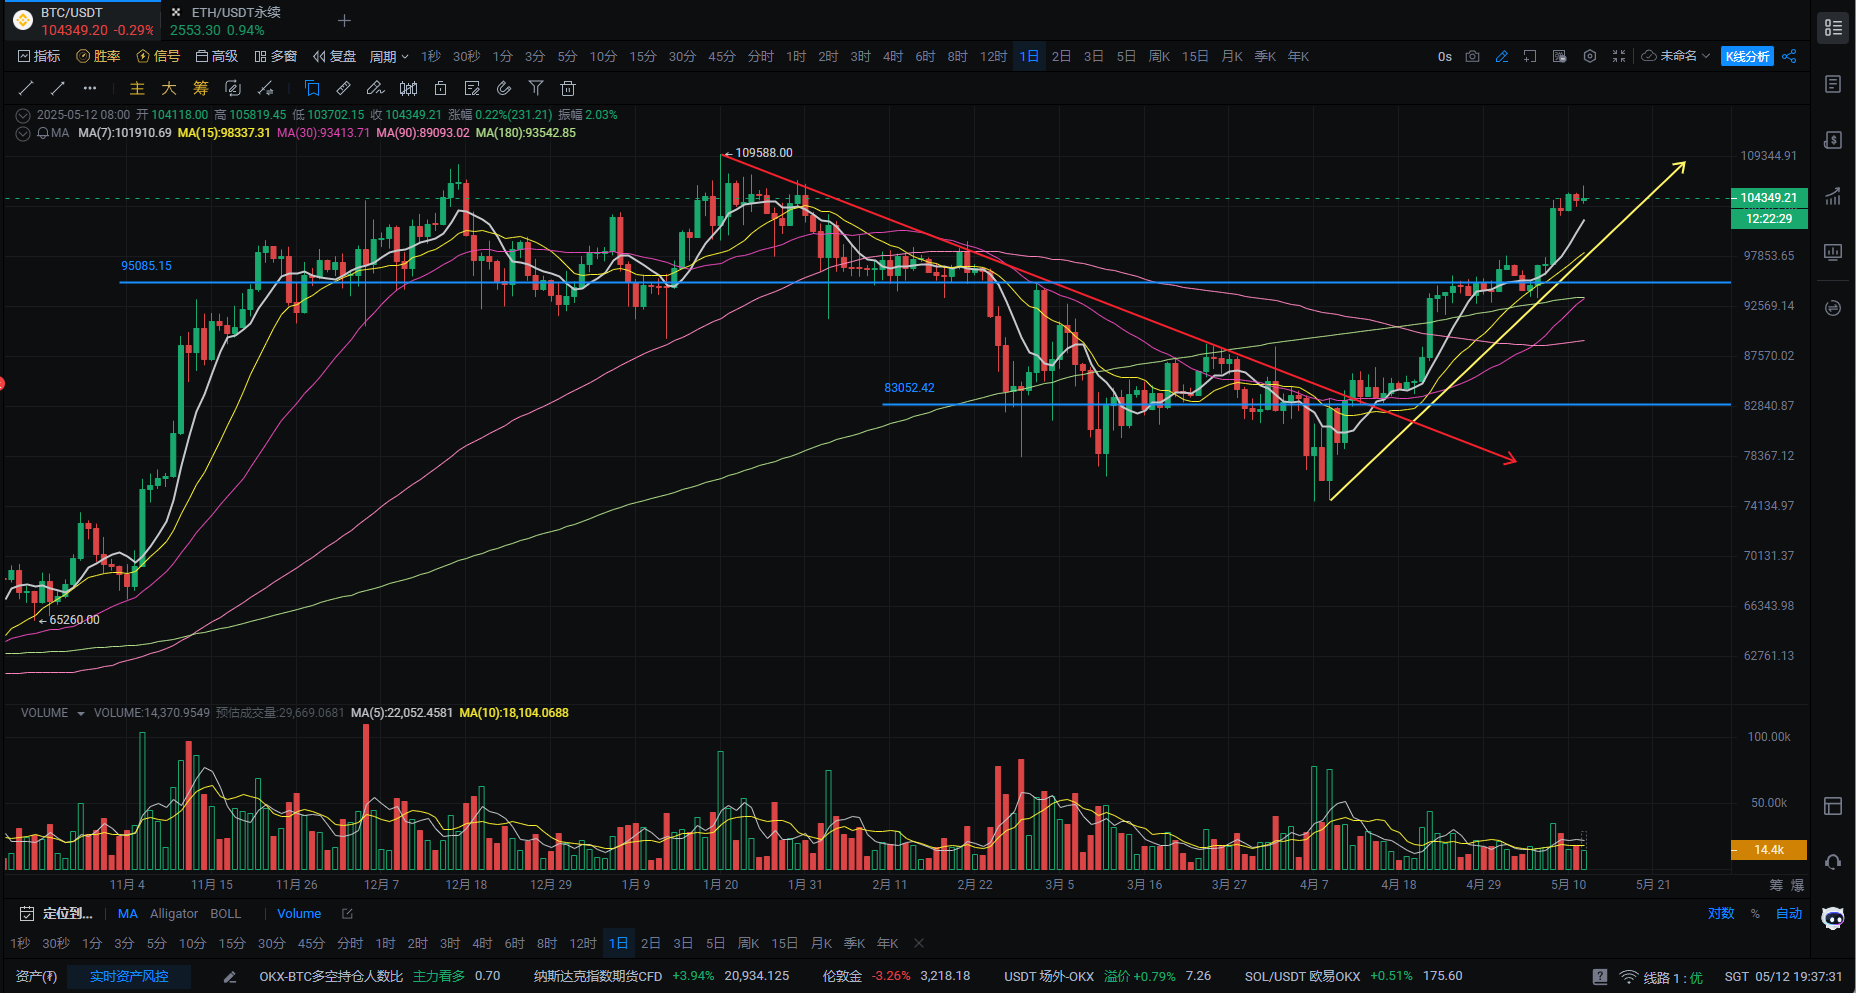
BTC: The weekly chart shows a solid bullish candle with a 9% increase, with prices approaching the previous high around 106K. The weekly chart has recorded five consecutive bullish candles, indicating a clear bullish trend. However, there are significant technical gaps, and caution is advised as the weekly chart may form a long lower shadow candle similar to the one seen since December of last year. The daily chart currently shows an overall upward trend, divided into three waves of increase, with the price at the top of the third wave. The increase in K-line is noticeably shrinking, transitioning from a diagonal rise to an arc. There is significant resistance at the 106K level, so avoid chasing highs; the market is expected to pull back after reaching a peak, and the daily chart is likely to enter a phase of adjustment. On the 4-hour chart, the price formed a relative high around the 105 level over the weekend, with a recent relative low around the 1023 level, overall oscillating within a range. For intraday operations, focus on support at the 1035-1025 level below and resistance at the 1055-1065 level above!
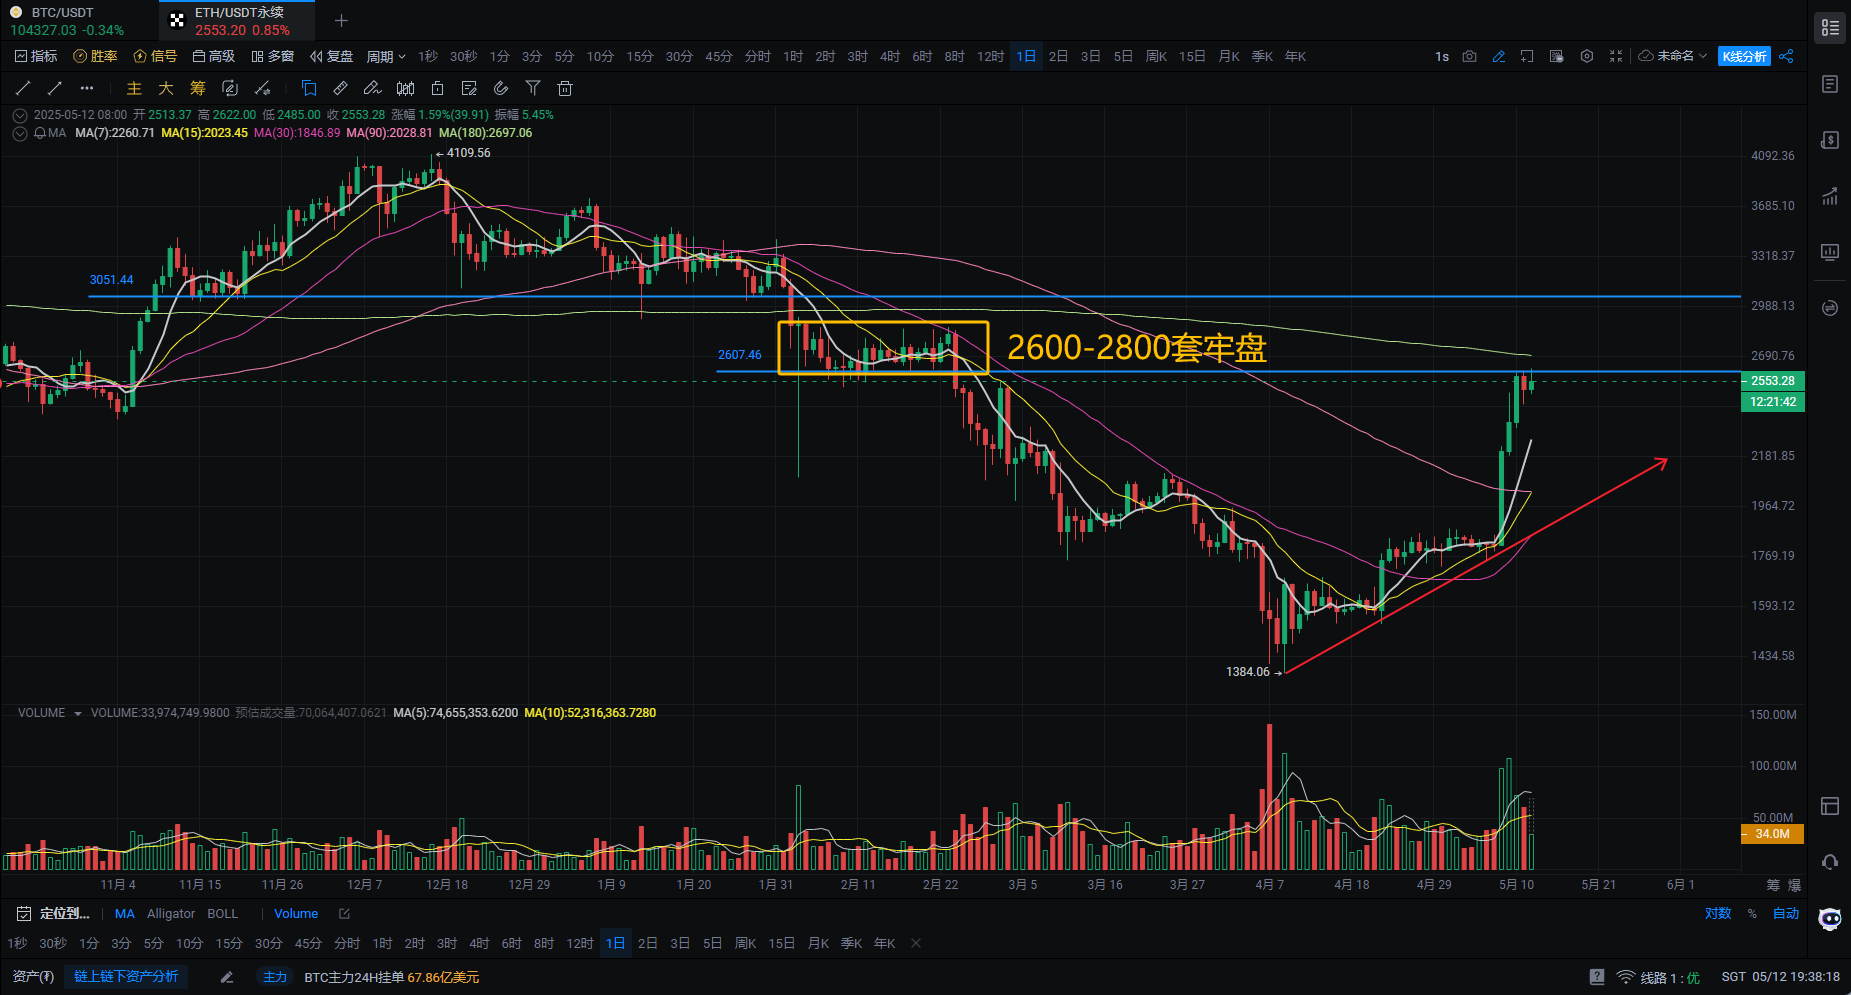
ETH: The Ethereum craze is extremely high, with a maximum weekly increase of 40%. The weekly chart shows a solid bullish candle, with a significant pullback after reaching around 2600 points yesterday, indicating substantial selling pressure in the 2600-2800 range from February. This week, focus on the 2680 level above for Ethereum. On the daily chart, the upward momentum is strong but has weakened, with profit-taking and selling pressure from previous bottom-buying exerting dual pressure. Ethereum's pullback after hitting the 2600 level is significant, and the market is expected to enter a phase of adjustment in the short term. This adjustment does not indicate a reversal to bearish; the extent of the adjustment will not be large, with important support for bulls at the 2280 level below. The 4-hour chart still shows an overall upward trend, but the rise is primarily characterized by oscillation. For intraday operations, focus on resistance at the 2580-2620 level above and support at the 2480-2440 level below.
Altcoins: If Bitcoin and Ethereum enter a phase of adjustment, especially the altcoins that have seen significant increases in the past few days, they will also enter an adjustment phase to build momentum for the next round of increases, creating important buying points for the third wave of market rises. OpenAI and Microsoft are in talks to unlock new funding and future IPOs; WLFI is set to work alongside Ethereum; in the upcoming market, in addition to the Ethereum upgrade sectors mentioned last week (wallets, staking, Rollup, modularization), focus on the AI sector!
He Yue: Yesterday, I made corresponding direct placements for some altcoin positions, currently holding POL, XRP, and Ethereum. This week, I will re-enter positions during appropriate adjustments. For intraday short-term trading, focus on the points analyzed above.
The cryptocurrency market is highly volatile; exercise caution when entering. This is a personal opinion, not advice, for sharing purposes only.
免责声明:本文章仅代表作者个人观点,不代表本平台的立场和观点。本文章仅供信息分享,不构成对任何人的任何投资建议。用户与作者之间的任何争议,与本平台无关。如网页中刊载的文章或图片涉及侵权,请提供相关的权利证明和身份证明发送邮件到support@aicoin.com,本平台相关工作人员将会进行核查。


