August 20th Air Felling: Bitcoin Consolidation May Brew a Major Market!

BTC/Daily Chart
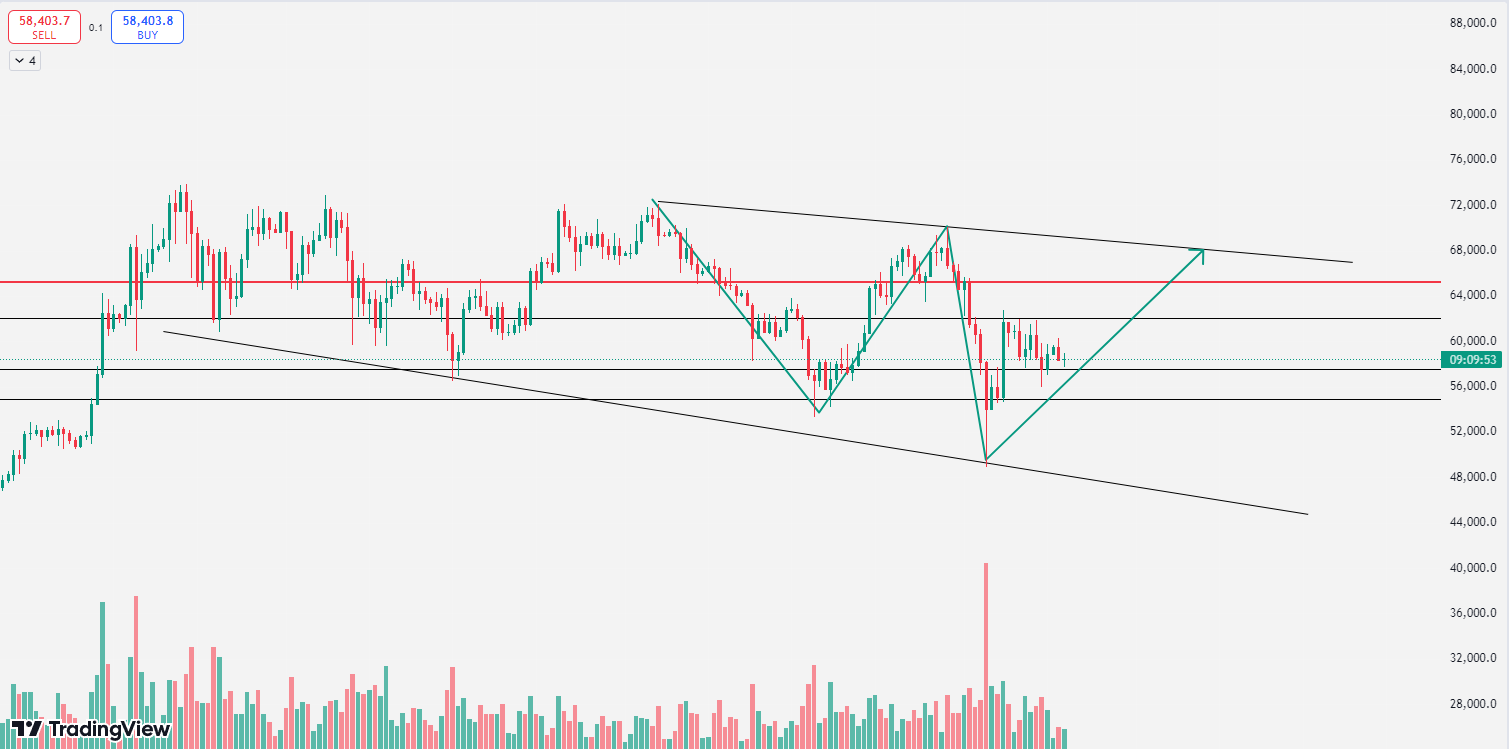
On the daily chart of Bitcoin, the K-line closed with a bearish candle yesterday, with the closing price near 58400, and the price turned down again. It coincides with the entry point mentioned in the article last Saturday. From the chart, it can be clearly seen that at the daily level, there is a wide range of oscillations, seemingly forming a triangular pattern, with gradually decreasing fluctuations. Once the price breaks through the triangle dilemma, it indicates that there will be a significant fluctuation. Considering the high probability that the weekly line will not deviate from around 56000, for tonight, even if there is obvious pressure at the resonance point technically, it cannot be said that the price will fall. We can only hope for the data to complement the technology. A simulation was conducted from the air felling at the end of July, predicting that the bearish trend is likely to extend to mid-August. The indicators in the attached chart also show that the bearish momentum has been almost exhausted. Therefore, tonight, the key support to focus on is the 56000 level. If it is not broken, the bullish trend will continue.
BTC/4h Chart
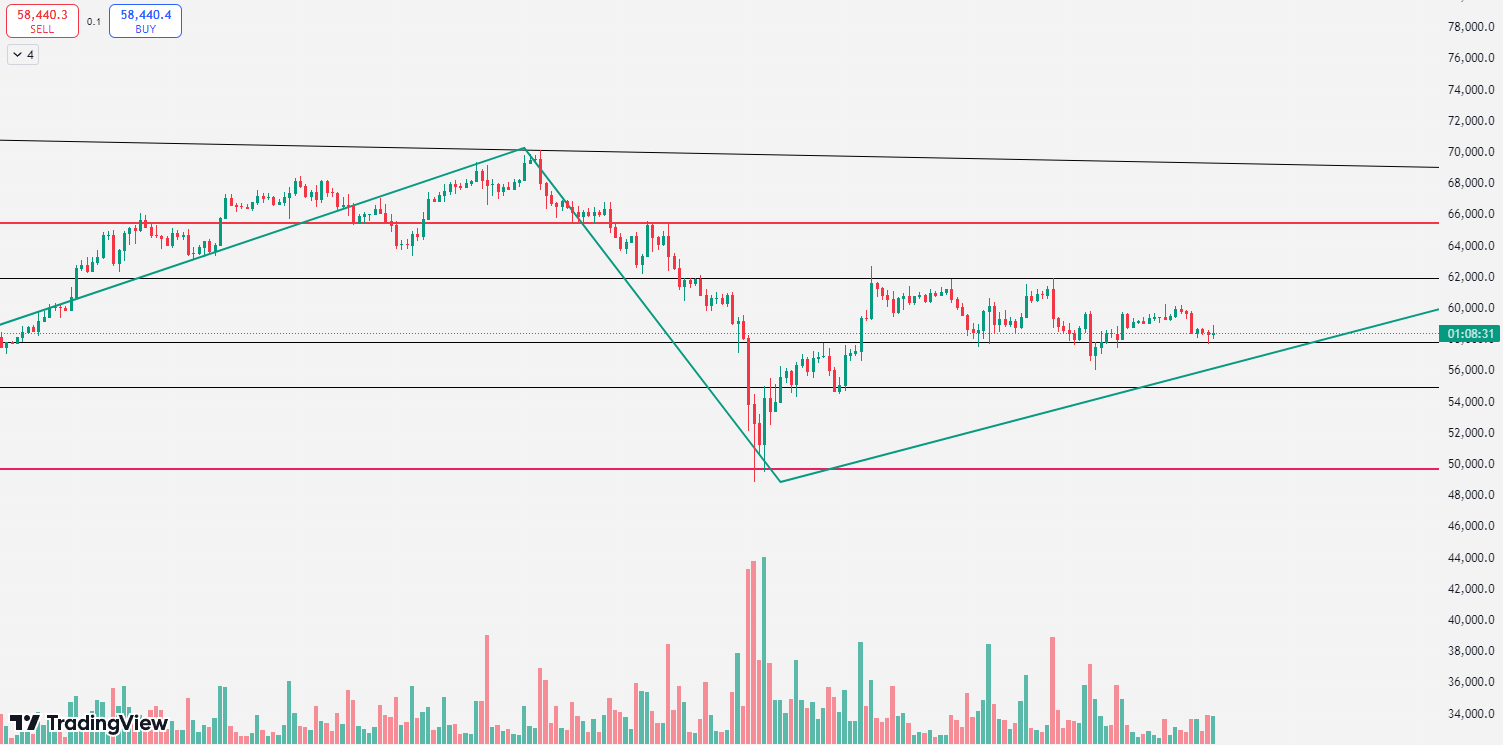
On the 4-hour chart of Bitcoin, it was under pressure at the 60300 level yesterday, oscillating and falling to around 57800. In the afternoon, it consolidated around the lower rail for a few hours, and then began to oscillate and adjust downwards. Because the market adjustment is mostly real, the bulls can participate. It will of course require data support to get out of the dilemma, but no matter how it brews, the possibility of a one-sided move is expected to occur in the next day or two. Technically, the resistance at 59000-60000 is obvious. If it is not effectively broken, it is inclined to initiate a short-term round of adjustment or slow grinding in the triangular area. Pay attention to 57500-56000 below. If it stabilizes and goes down, it can be bullish in the short term, because the market adjustment is mostly oscillating. The decision to continue holding will depend on the subsequent force.

Strategy 1: It is recommended to go long with a light position at 58000-57500, add positions at 57000, stop loss at 56500, and target around 60500-61000.
The above is a personal suggestion, for reference only. Investment involves risks, and trading should be cautious.
There may be a delay in the release of the article, and the market is ever-changing. The mentioned points in the article do not serve as a basis for follow-up. For more information on the market and resolving orders, refer to the real-time strategy of air felling.
Scan and follow the public account below for more information: Band Air Felling

Comprehensive guidance time: 7:00 AM to 2:00 AM the next day
This article is original content by Band Air Felling, with over ten years of investment experience, having handled funds at the level of tens of millions, familiar with the operation of main funds, washing and absorbing chips, and boosting techniques. It can grasp the combination of knowledge and action in fund management, position control, investment portfolio, and investment mentality. Proficient in judging and analyzing the overall market trend, and well-versed in various candlestick technical tactics, with deep insights into wave theory, pattern theory, and indicator theory. Scan and follow the public account above for technical market learning and communication.
免责声明:本文章仅代表作者个人观点,不代表本平台的立场和观点。本文章仅供信息分享,不构成对任何人的任何投资建议。用户与作者之间的任何争议,与本平台无关。如网页中刊载的文章或图片涉及侵权,请提供相关的权利证明和身份证明发送邮件到support@aicoin.com,本平台相关工作人员将会进行核查。


