8月14日空伐:CPI数据能否破局,比特币后市该何去何从?

BTC/日线图
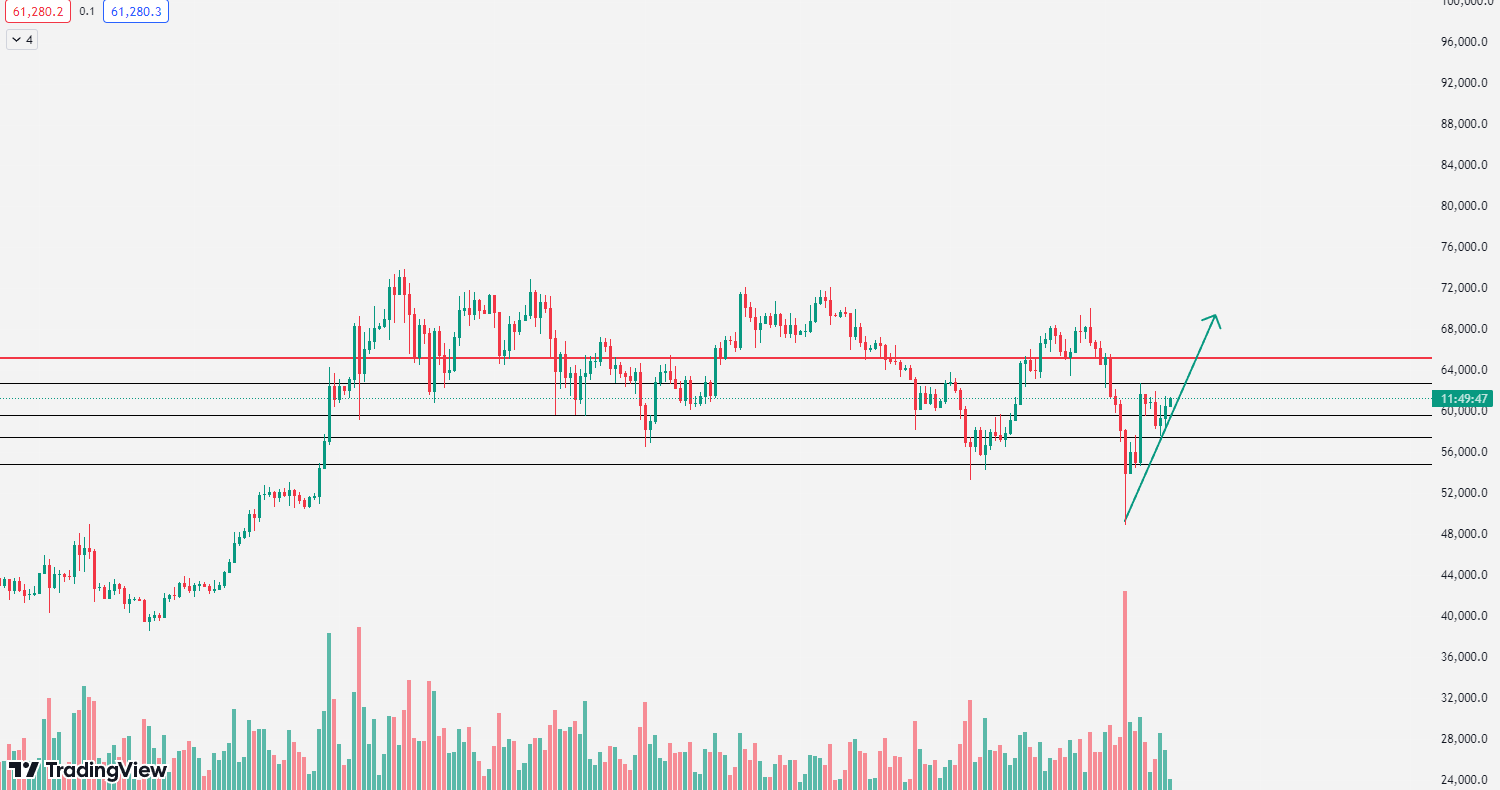
比特币日线级别,昨日稳住10均线收跟阳线,价格处于57500前低之上,短期表明他是属于多头趋势下的强势修正,后续依然短时间容易突破62000阻力,而这种强势修正走法,最大的特点就是不断依托短期均线5日或10日阶梯试逼空震荡走高,最终迎来加速的单边拉升,那么目前,今日5均线支撑60500一线,此位置上保持继续顺势看涨即可,上方阻力短线助力62000预计是守不住,阻力继续上移至63500~64000这一带震荡区域。
BTC/4h图
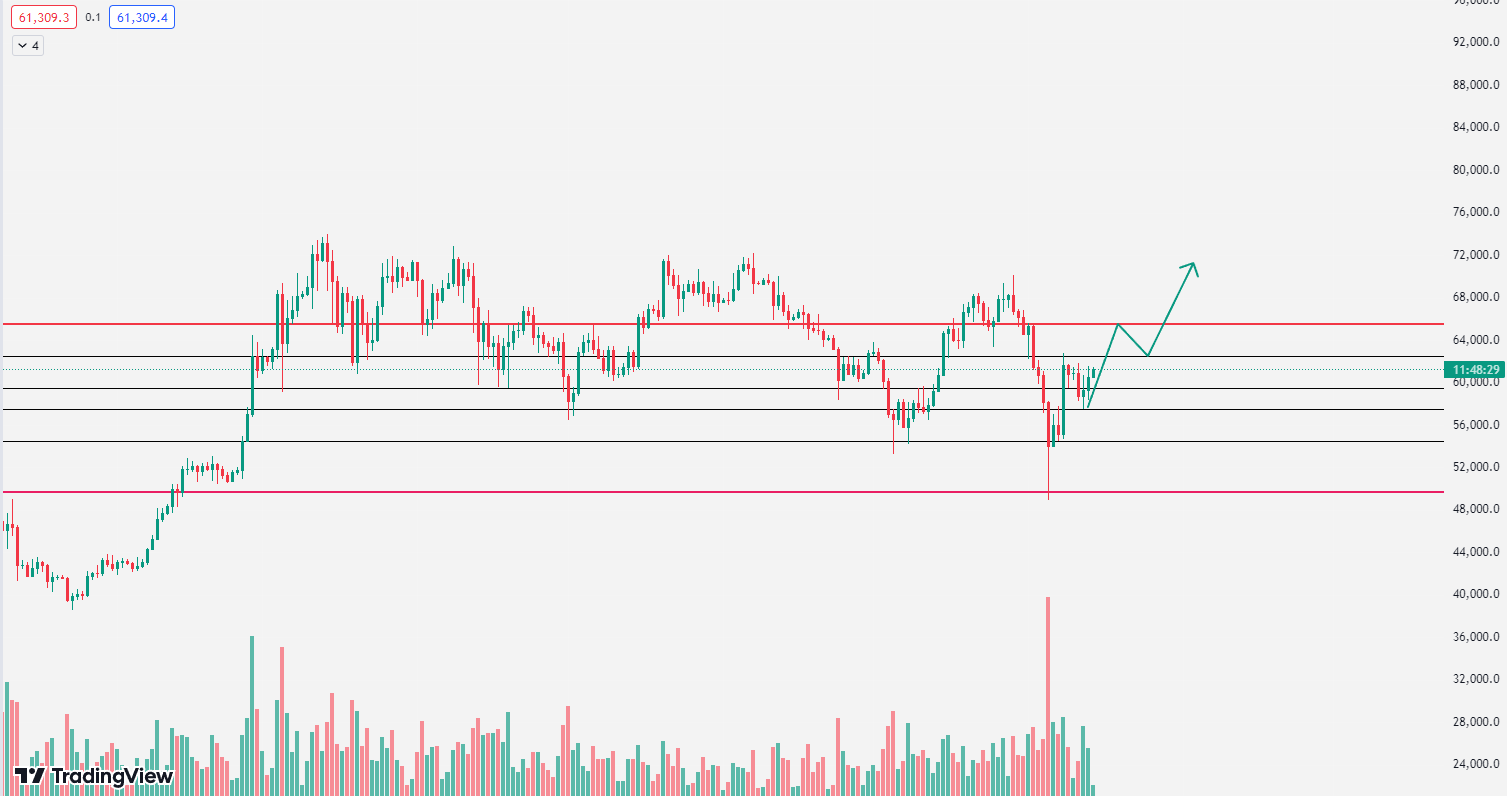
比特币4h级别,结合今晚CPI数据,大概率波动不会持续性发酵,一般这种数据出来后可能会维持在半个小时内,后续将会继续回到技术面来,那么这种规律很容易照成诱盘假象,一旦步入强势修正走法,那么日内运行规律一般是,隔夜持续拉升走高,第二天早间持续涨,对于今晚来讲,就是等待企稳去看涨即可,从图中来看,继续依托10均线58500存在一定的下轨支撑也是最后的防守位,是首要试探的看涨点,短期阻力62000,其次是63500~64000范围,一旦重回中轨之上,就容易幔涨强势走高了。

策略一:建议60000~59500分批/做多,防守58500,目标看63500~64000附近
策略二:建议63500~64000分批/做空,止损64500,目标看62500~62000附近
以上为个人建议,仅供参考,投资有风险,交易须谨慎
发文有延迟行情瞬息万变·文中提及点位不具有跟单依据·了解更多行情及解单∫套单以空伐实时策略为准
保存扫码关注下方公众号:波段空伐

全方位指导时间:早7:00~次日凌晨2:00
本文由/波段空伐∫原创,拥有十多年投资经验,接受过千万级别资金运行,熟知主力资金运行,洗盘吸筹和拉升手法,对资金管理、仓位控制、投资组合和投资心态的把握能做到知行合一,擅长大盘趋势的研判和分析,精通各类K线技术战法,对波浪理论,形态理论,指标理论有极深的见解,学习技术行情交流扫描关注上方公众号
免责声明:本文章仅代表作者个人观点,不代表本平台的立场和观点。本文章仅供信息分享,不构成对任何人的任何投资建议。用户与作者之间的任何争议,与本平台无关。如网页中刊载的文章或图片涉及侵权,请提供相关的权利证明和身份证明发送邮件到support@aicoin.com,本平台相关工作人员将会进行核查。


