
Last night, there was a malfunction in the early trading session of the US stock market, causing the stock prices of several large companies (Berkshire Hathaway, McDonald's, and Wells Fargo) to plummet by as much as 99.9%. The extreme price fluctuations led to the suspension of trading for the affected securities, but later trading for Berkshire Hathaway and other affected securities resumed, and the issue has since been resolved. This also exposed the vulnerability of the traditional financial system to critical flaws due to its highly centralized architecture.
Bitcoin surged to 70288 and then dropped to 68500, with a decline in volume over 4 hours. It rebounded near the previous low in the early morning. Ethereum is still supported by the lower boundary of the flag pattern at 3730. The US dollar index has finally broken the long-awaited upward channel, which is a cause for celebration. Keep a close eye on the market as Bitcoin is likely to change its trend soon.
Bitcoin
Reasons for bullish view:
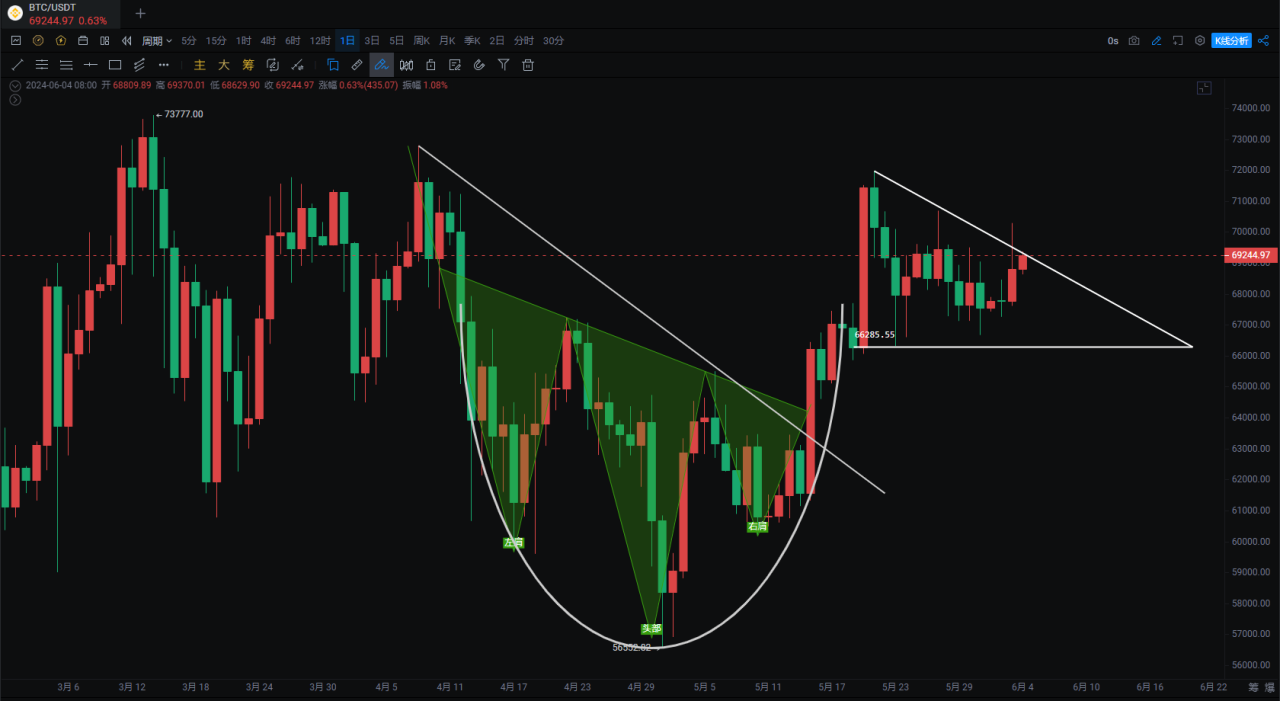
Arc bottom + head and shoulders pattern breakout from the downtrend, currently testing the neckline support at 66000.
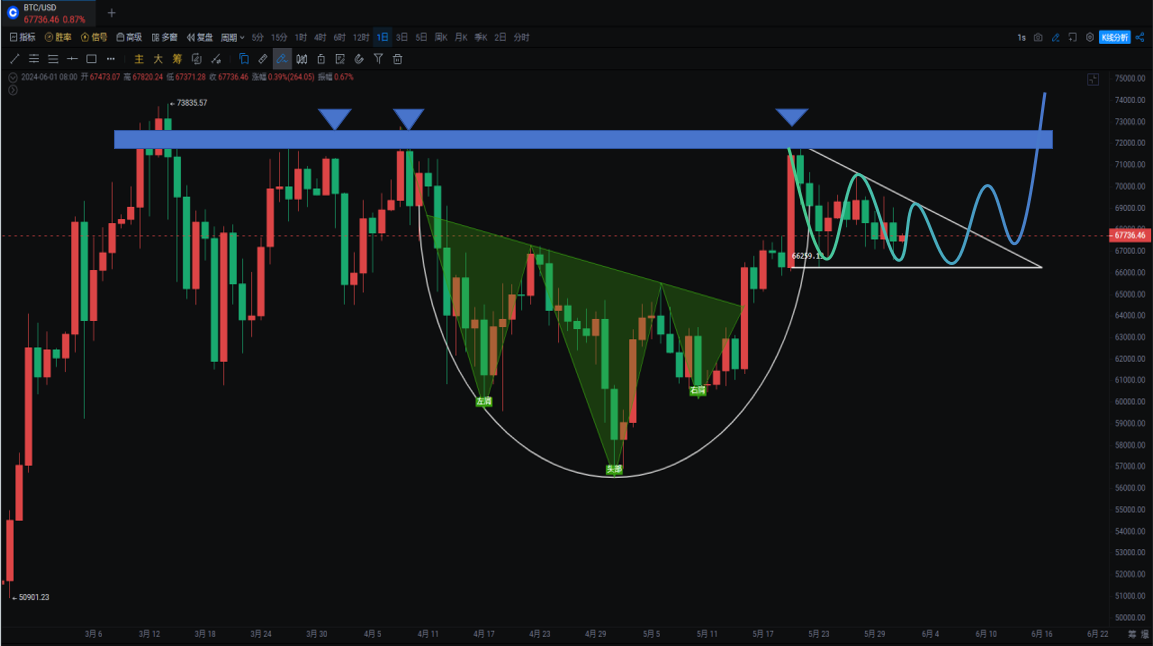
The triangle structure supported by the bottom of the large bullish candle on May 20 is also testing the support at 66000, and the uptrend line on the daily chart has not been broken. As long as it doesn't break, it's still bullish; if it breaks, consider a bearish reversal.
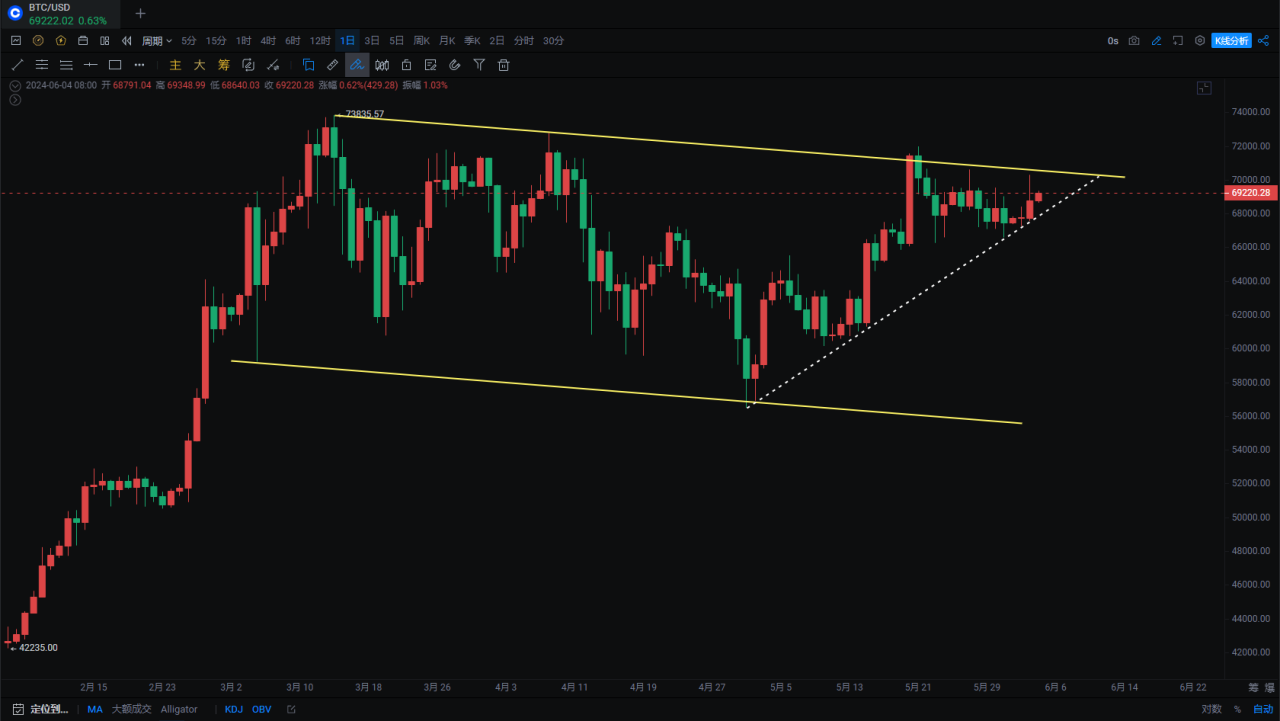
The daily chart has tested the resistance of the upper boundary of the descending flag pattern 5 times, but the price has not dropped significantly.
The current wave structure on the weekly chart is still in the 5th wave, and breaking through 73777 is necessary to open up the upward space.
Technical indicators are all above the Bollinger Bands on the monthly, weekly, and daily charts. RSI, KDJ are all in a bullish position on the weekly, monthly, and daily charts, and the MA moving average system has been bullish all along. The only drawback is that the MACD on the weekly chart is not in sync, so pay attention to whether it will catch up on the daily chart.
Support:
Resistance:
Ethereum
Reasons for bullish view:
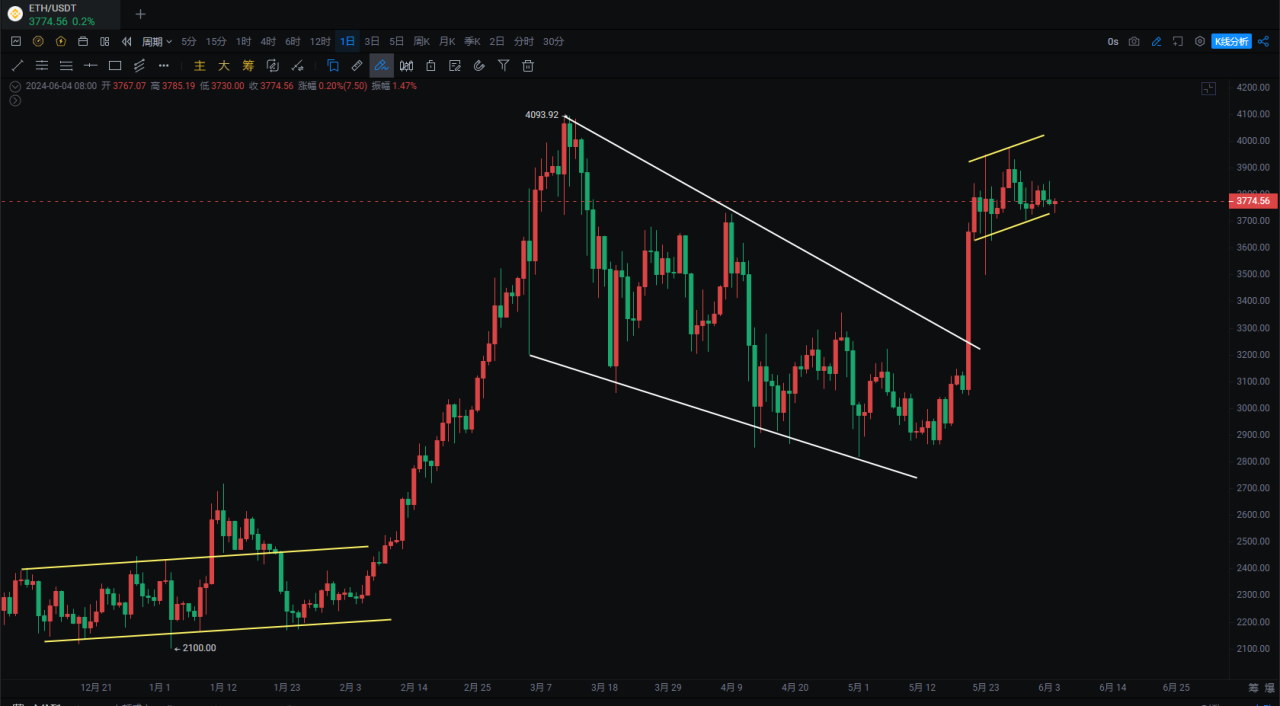
The monthly chart shows a bullish engulfing pattern, the weekly chart shows a bullish harami pattern, the MACD histogram has crossed the zero axis, the daily chart shows an ascending flag pattern, and the golden cross of the moving averages has appeared. In the near future, there is a relatively large increase waiting for the MA20 to approach the price. Compared to the previous rally to 4094, it also oscillated within an upward channel for over 60 days. We previously mentioned that the area around 2800 was a phase bottom, and after that, a single line rose 20% from 3000 to 3700. Most retail investors did not have bottom chips, so it is unlikely to fall back in the short term. Let's continue to grind until everyone loses patience, and then the natural market will come.
Support:
Resistance:
If you like my views, please like, comment, and share. Let's navigate the bull and bear markets together!!!
The article is time-sensitive and is for reference only, subject to real-time updates.
Focus on candlestick technical research, and win-win global investment opportunities. Official account: Trading Master Fusu

免责声明:本文章仅代表作者个人观点,不代表本平台的立场和观点。本文章仅供信息分享,不构成对任何人的任何投资建议。用户与作者之间的任何争议,与本平台无关。如网页中刊载的文章或图片涉及侵权,请提供相关的权利证明和身份证明发送邮件到support@aicoin.com,本平台相关工作人员将会进行核查。


