2024.05.09 Thursday

After the expected decline, is the bear market over?

① 20:30 US Initial Jobless Claims for the week ending May 4
② 02:00 the next day, Fed's Daley participates in a fireside chat

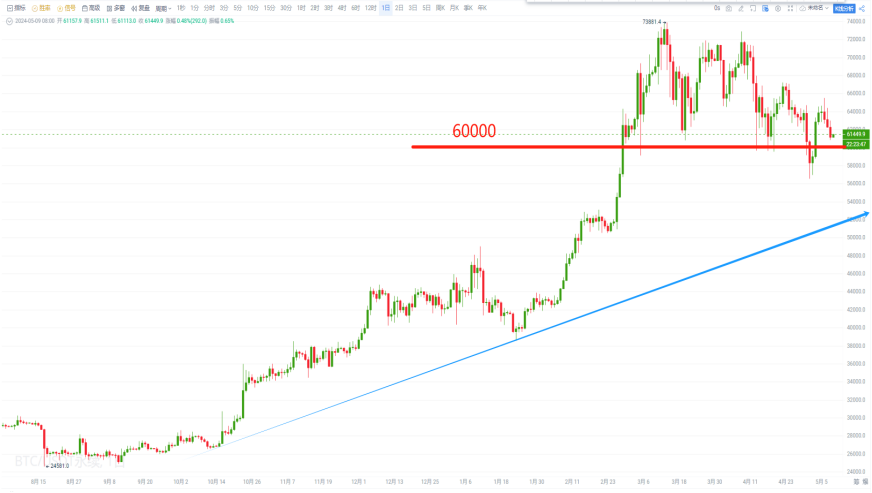
- Daily chart: After breaking below the 60,000 level, the price returned above it. If the subsequent pullback does not break this level, there is still a trend of continued rise.
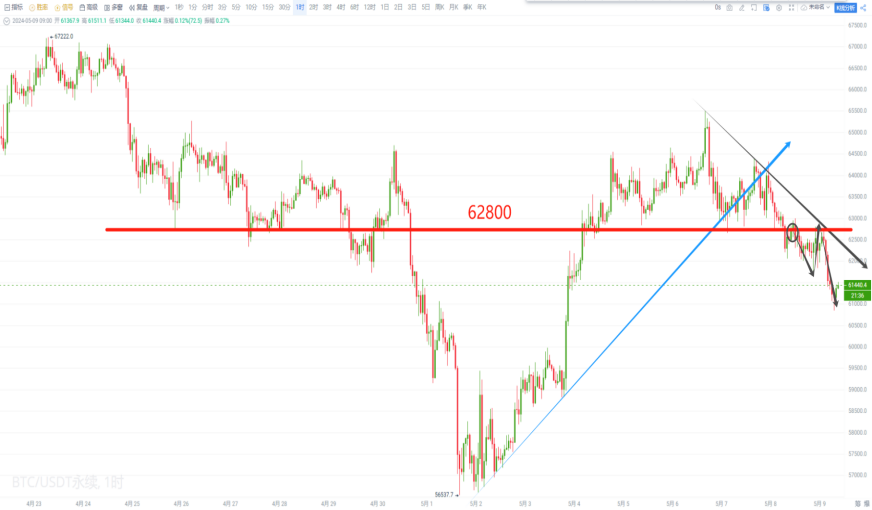
- 1-hour chart: After a short-term break below the 62,800 level, there was a rebound. If the subsequent rebound does not break this resistance, there is still a trend of continued decline.

II. Ethereum
Daily chart: After probing the 3,100 level, there was some fluctuation. If the subsequent fluctuation does not break this support, it is still an upward trend.

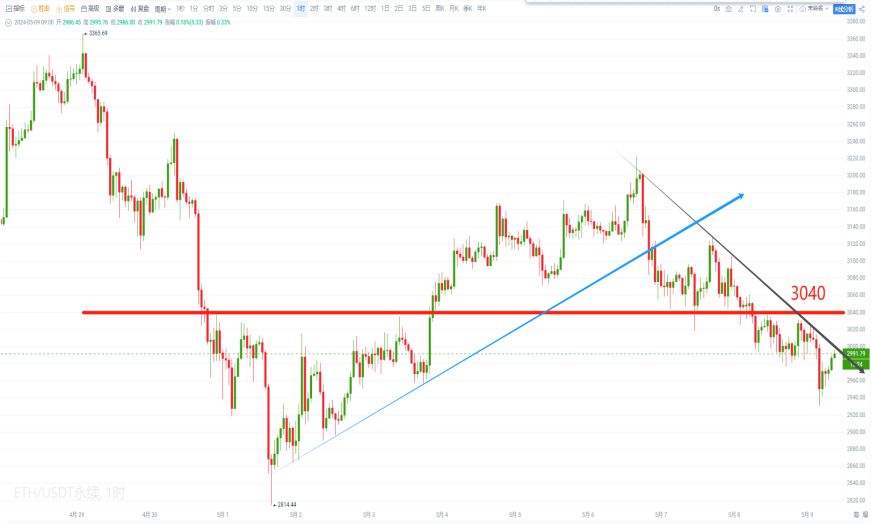
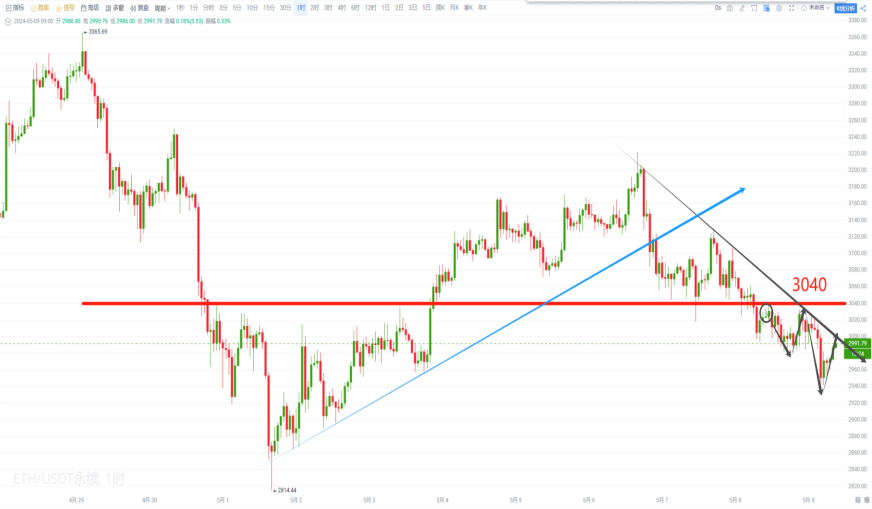
- 1-hour chart: After a short-term break below the 3,040 level, there was a rebound. If the subsequent rebound does not break this level, there is still a trend of continued decline.

I. Bitcoin
- Yesterday's view:
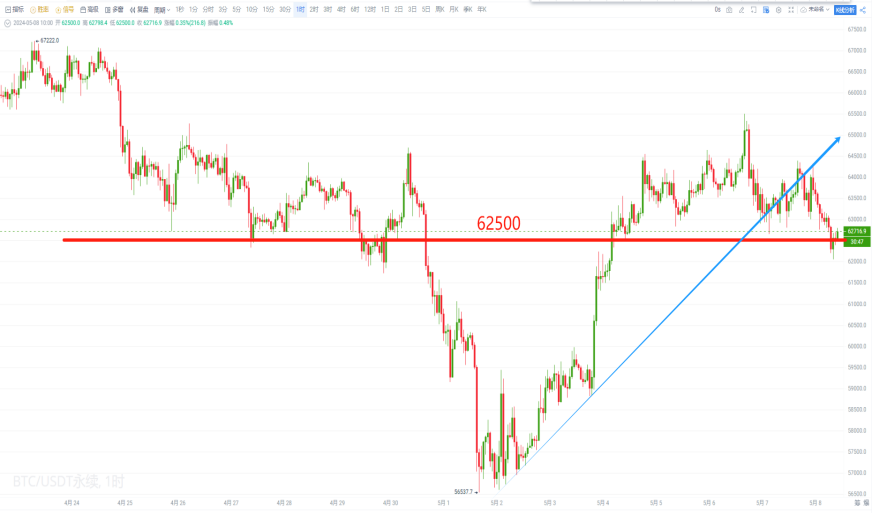
Summary: After a short-term probe below the 62,500 level, the price maintained near this level, and if it effectively breaks below, the downward space will expand. Support below is at the 60,000 and 57,200 levels. If it stabilizes above, there is hope for a rebound, with resistance above at the 65,000 and 67,100 levels.
- Subsequent trend:
After effectively breaking below the 62,500 level, it continued to decline, reaching a low of 60,843.
II. Ethereum
- Yesterday's view:

Summary: After a short-term break below the 3,080 level, it continued to decline. If the rebound does not break this level, there is still a trend of continued decline, with support below at the 2,900 and 2,790 levels. If it breaks above, there is hope for a rebound, with resistance above at the 3,210 and 3,340 levels.
- Subsequent trend:
After the rebound failed to break the 3,080 level, it continued to decline, reaching a low of 2,930.

I. Bitcoin
Summary: After a short-term break below the 62,800 level, there was a rebound. If the subsequent rebound does not break this resistance, there is still a trend of continued decline, with support below at the 59,000 and 56,600 levels. If it stabilizes above, there is hope for a rebound, with resistance above at the 65,400 and 67,900 levels.
II. Ethereum
Summary: After a short-term break below the 3,040 level, there was a rebound. If the subsequent rebound does not break this level, there is still a trend of continued decline, with support below at the 2,870 and 2,760 levels. If it breaks above, there is hope for a rebound, with resistance above at the 3,170 and 3,300 levels.


Join the Pionex community to enjoy the following services:
- Morning video explanation updated daily;
- Daily updated text and image viewpoints;
- Technical indicator analysis and answers in the group;
- Layout of long and short strategies in the medium and long term;
- High winning rate short-term trading strategies for the day;
- Trading system long and short signals reference software authorization;
- Enjoy lower transaction fees by joining the community for practical combat;
- One-on-one or one-on-many guidance and answers (by appointment);
- Multiple learning courseware packages to bid farewell to not understanding;
- Multiple analysts (lecturers, practical teachers) take you through the world of coins, with seven live courses daily.


免责声明:本文章仅代表作者个人观点,不代表本平台的立场和观点。本文章仅供信息分享,不构成对任何人的任何投资建议。用户与作者之间的任何争议,与本平台无关。如网页中刊载的文章或图片涉及侵权,请提供相关的权利证明和身份证明发送邮件到support@aicoin.com,本平台相关工作人员将会进行核查。