
When others are fearful, I am greedy; when others are greedy, I am fearful. This is a phrase familiar to traders, but very few can truly apply it.
The second sentence is how to outperform more than 90% of investors? First of all, you must be completely opposite to 90% of people in many aspects, which is what we often call going against human nature.
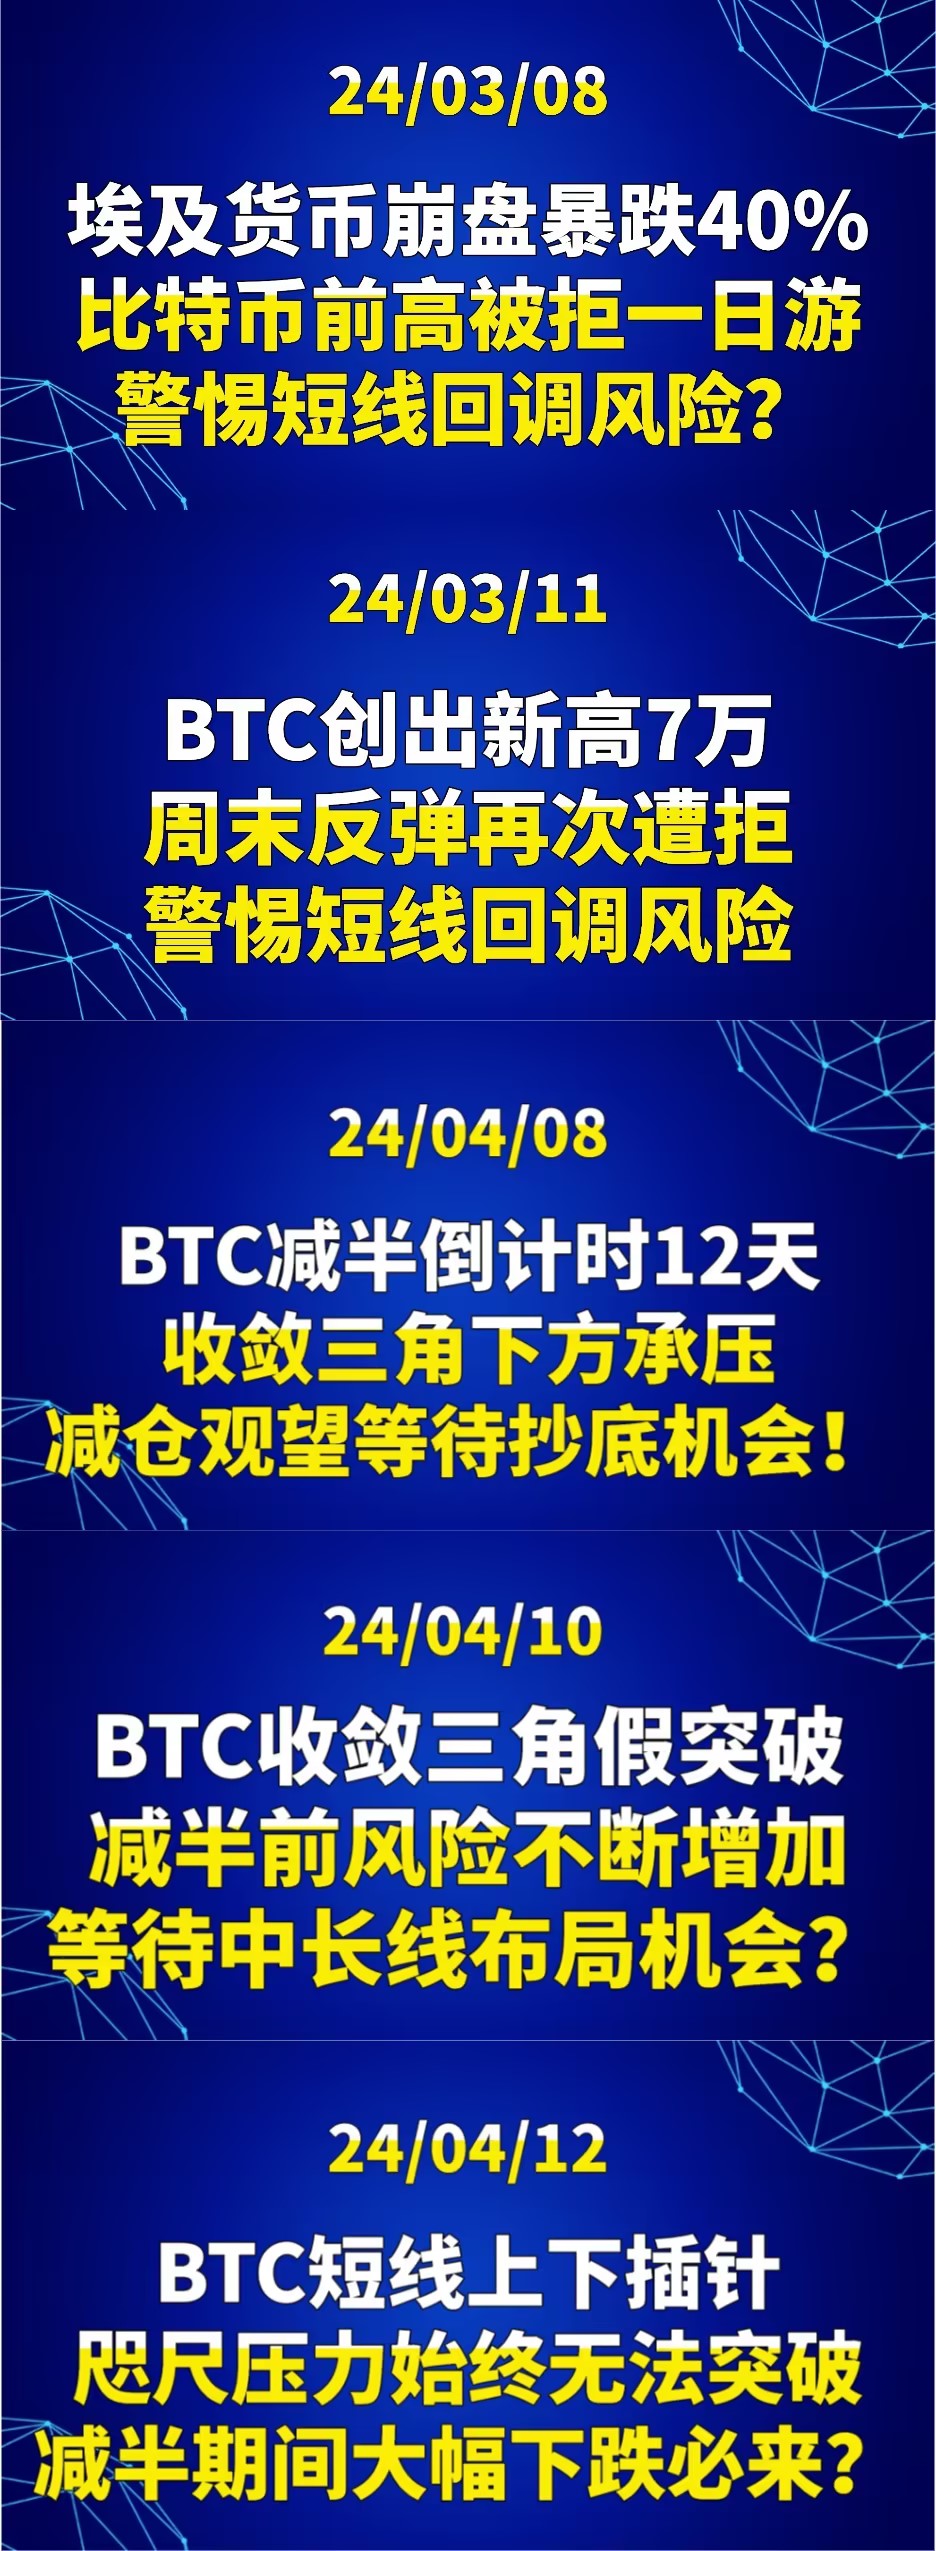
As early as 24/03/08, the Egyptian currency collapsed and fell by 40%, and Bitcoin's previous high was rejected in a day. Beware of the risk of short-term pullback.
On 24/03/11, BTC hit a new high of 70,000, but the rebound over the weekend was rejected again. Beware of the risk of short-term pullback.
On 24/04/08, 12 days before the halving of BTC, it was under pressure below the convergence triangle, reducing positions and waiting for the opportunity to buy the dip.
On 24/04/10, BTC's convergence triangle false breakout, increasing risks before the halving, waiting for medium to long-term layout opportunities?
On 24/04/12, BTC's short-term up and down movements, the pressure has always been unable to break through, a substantial decline is inevitable during the halving period?
On 24/04/13, multiple tops of BTC before the halving, a large distribution, is it a buying opportunity or a continued decline? Will a black swan event occur?
On 24/04/16, miners selling off before the halving, fearing a significant downward pressure on BTC, the risk of a decline is still unresolved.
On 24/04/25, BTC halving turns bearish, be cautious of a sharp decline at high levels, as previously warned, a substantial decline is inevitable.
On 24/04/29, BTC's monthly outflow signal, no breakthrough of important resistance, beware of a sharp decline.
On 24/04/30, Hong Kong ETF listed below the issue price, BTC spiked to 64,500, but the rebound is weak and the bearish trend is strong.
There must be mistakes in the analysis and operation in the middle. Small retracements can be understood, but fundamental mistakes cannot be made.
Let me talk about the three major stock indexes in the peripheral US stock market: Dow Jones rose by 0.46%, Nasdaq rose by 1.19%, and S&P 500 rose by 1.03%. MicroStrategy rose by nearly 5%. The US dollar index is under pressure at 106.5 and is pulling back. The weekly chart shows a bearish evening star, but it also faces the question of whether the uptrend line will be broken. If it is broken, it will be a good opportunity for global investment assets, and the same goes for Bitcoin. On May 1st, the US dollar index once again touched near 106 and fell, and Bitcoin also coincidentally experienced a sharp decline and rebound on May 1st, which should be understood by friends who often read my analysis without going into details.
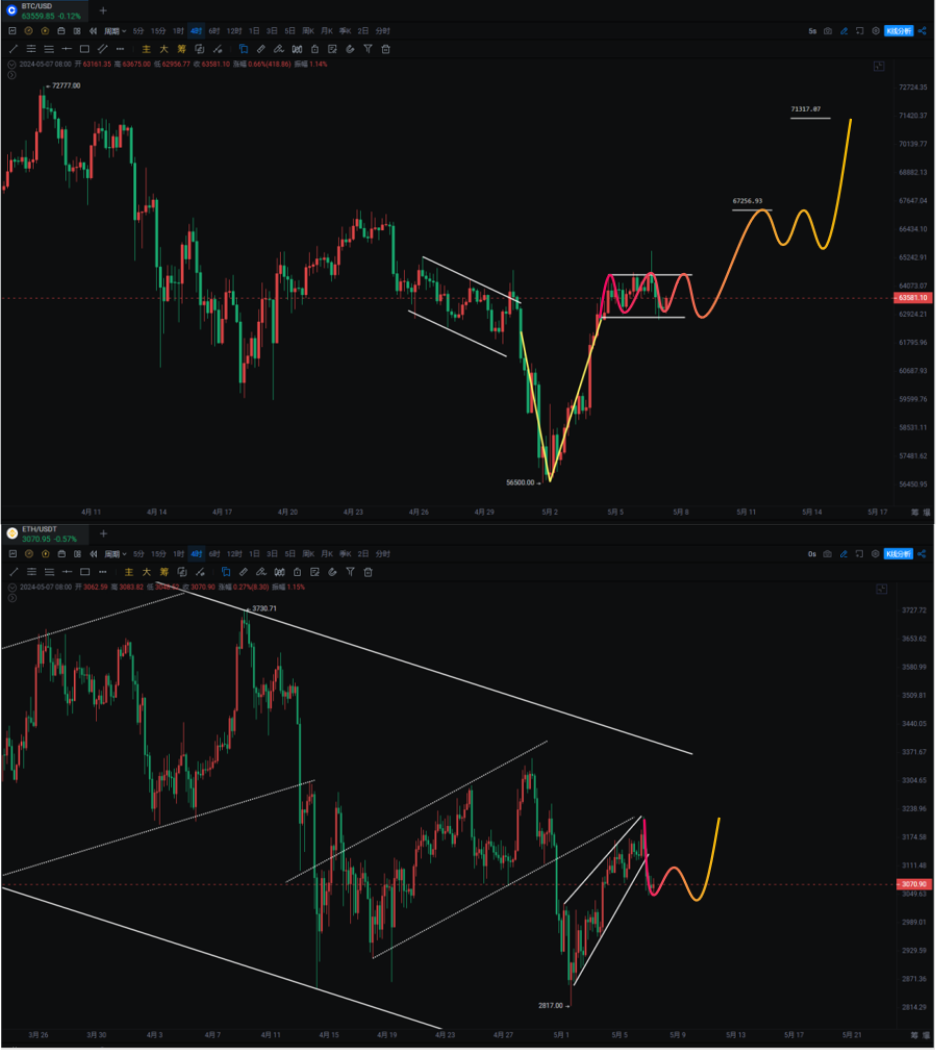
Bitcoin spiked to 65,500 yesterday and then fell back to fill the CME gap at 63,362. Ethereum broke through the rising trend line and once again tested the support at 3,000-3,040. The ETH/BTC exchange rate slid back to 0.046, which is why I consistently prefer to buy the dip in Bitcoin and Ethereum. Strong rebounds in altcoins such as TRB, ARKM, RNDR, WLD, BOME… with gains of over 30%.
Bitcoin: Bitcoin's weekly chart has retested the bottom and risen back to above 59,600-60,600. As long as it does not fall back below this range, it is considered valid. From a wave theory perspective, the weekly chart has completed a 5-wave structure from the rise from 15,400 to the present. We previously mentioned that the top at 73,777 is not a top structure, so we consider it a continuation of the correction. If we start the uptrend from 24,900 on the daily chart, it is currently in a potential 5th wave rally after a 4th wave correction.
Daily chart shows a flag pattern, with the price line in the middle. It is still oscillating within the box or flag shape. Previously, a perfect bullish bat pattern warned of a rebound from around 53,000-56,000, with the lowest falling to 56,555. The downtrend line on the daily chart was broken, and a bearish bat pattern appeared on the 4-hour chart at 71,500-72,000, increasing the probability of breaking out of the box or flag shape. Once the medium to long-term trend is broken, we may see 80,000.
In the short term, the 4-hour rebound broke through the downtrend line, continued to rebound after oscillating, and the next resistance level is 67,300. If it breaks through, there is hope to see the upper channel of the flag shape.
Support: Resistance:

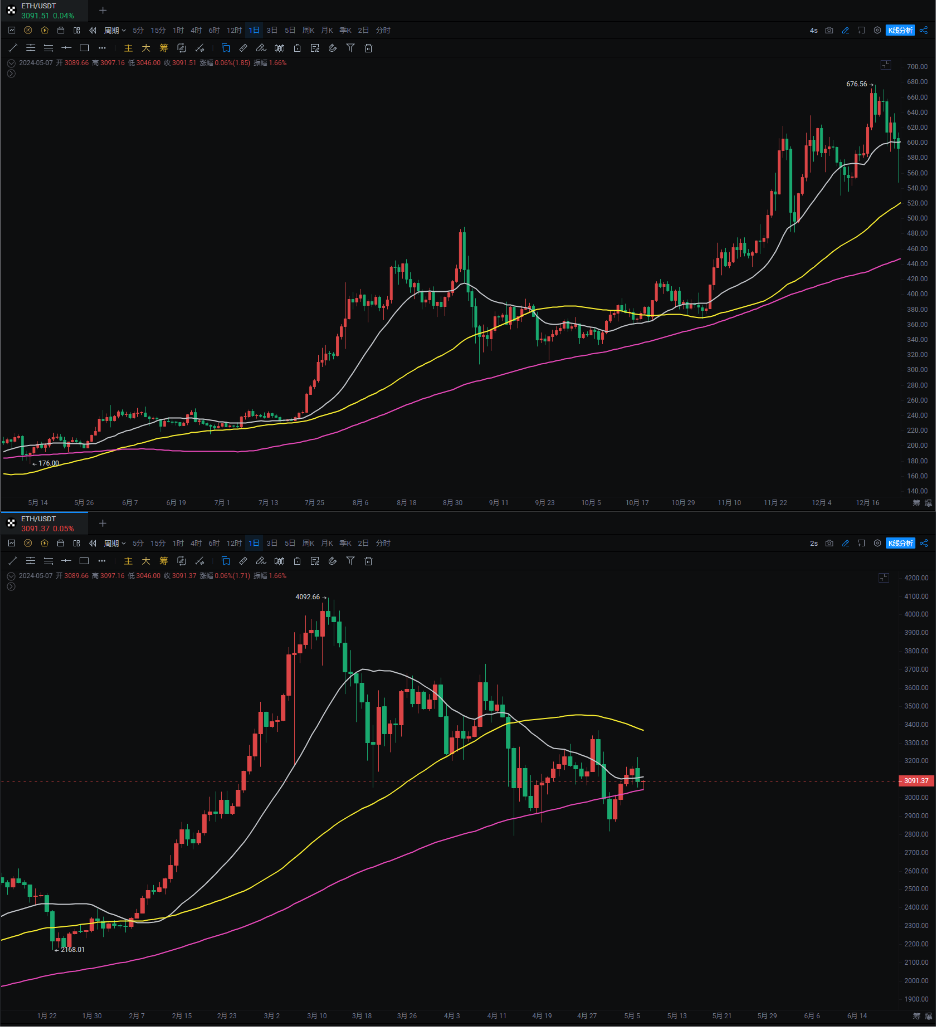
Ethereum: Ethereum's movement is very grinding. Referring to the trend in September-October 2020, there are some similarities. As long as Bitcoin does not falsely break through, Ethereum may have the potential to rise. This wave of Ethereum's 31% retracement has been repeatedly oscillating around the MA120, and there is a chance to add positions near 2,800 during a pullback, for medium to long-term layout.
Support: Resistance:
If you like my views, please like, comment, and share. Let's navigate the bull and bear markets together!!!
The article is time-sensitive and is for reference only, with real-time updates.
Focus on candlestick technical research, win-win global investment opportunities. WeChat public account: 交易公子扶苏

免责声明:本文章仅代表作者个人观点,不代表本平台的立场和观点。本文章仅供信息分享,不构成对任何人的任何投资建议。用户与作者之间的任何争议,与本平台无关。如网页中刊载的文章或图片涉及侵权,请提供相关的权利证明和身份证明发送邮件到support@aicoin.com,本平台相关工作人员将会进行核查。


