Since hitting a rebound high of 67232 on April 23, BTC has continued its weak downward trend for over a week, and there is still no sign of a conclusion. In professional terms of the Chan theory, the downward trend at the 4-hour level corresponds to a downward trend at the sub-level of 30 minutes, which is still growing downward. The central axis of the 30-minute downward trend has not yet appeared, indicating that the pullback is probably not yet complete.
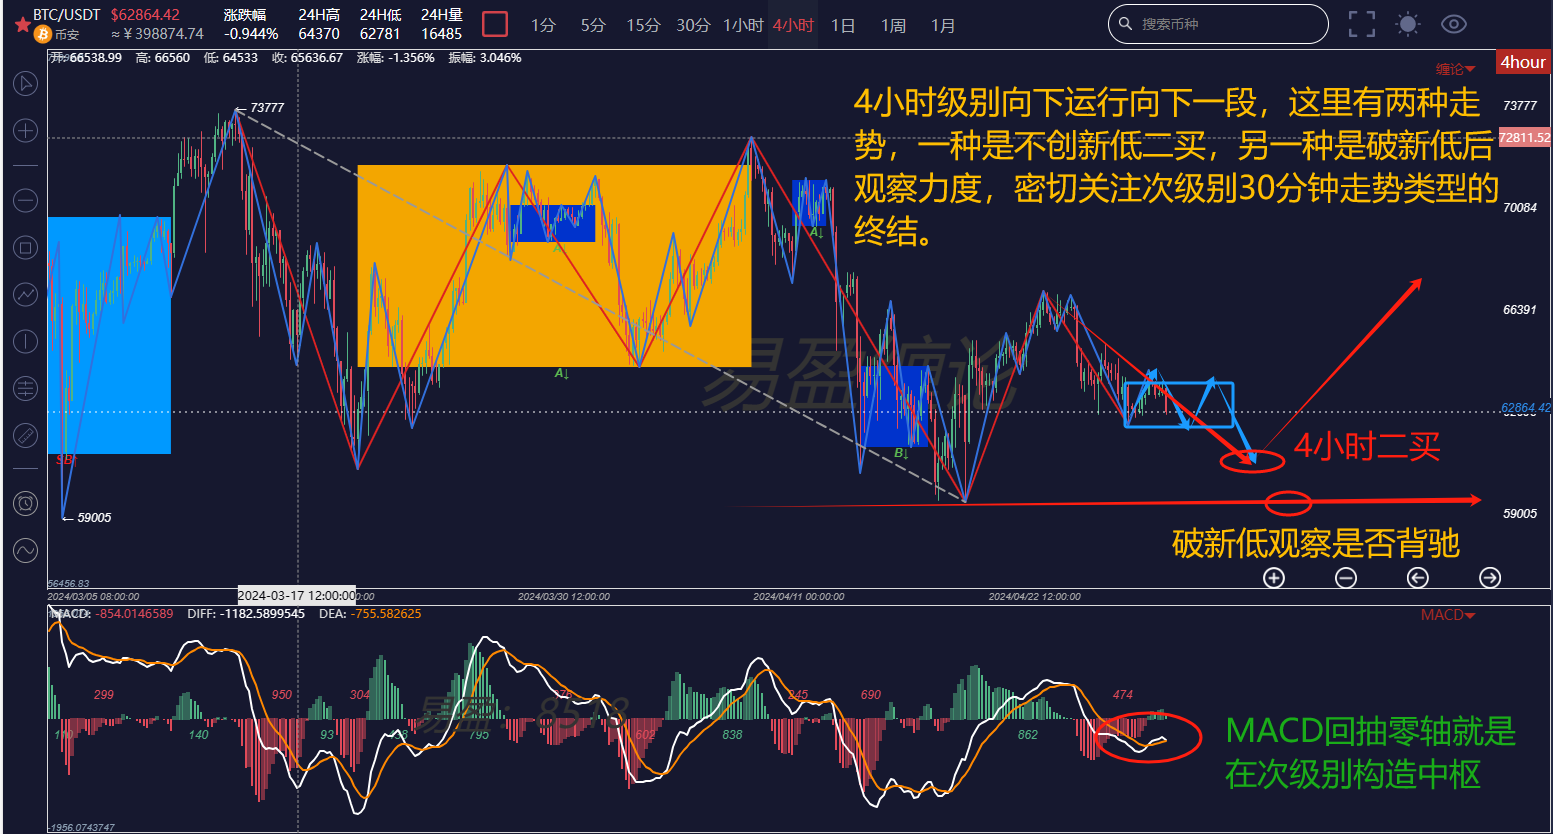
First, let's look at the 4-hour chart. The current trend is a downward trend at the 4-hour level, and there is no clear structure within this downward trend, so it is still impossible to judge whether the decline has ended. Only when the pen central axis appears as shown in the chart can a judgment be made. Therefore, those who want to buy the dip can continue to wait for the appearance of a buying point in the downward trend at the sub-level of 30 minutes.

Next, let's look at the downward trend at the sub-level of 30 minutes corresponding to the downward trend at the 4-hour level. The current trend is a three-sell downward trend, and it is highly probable that a new central axis will be constructed before testing the low point of 59600. Whether it will break or not will depend on the appearance of the 30-minute central axis.
In summary, for medium to long-term traders, all that is needed at the moment is to patiently wait for the appearance of a new central axis in the downward trend at the sub-level of 30 minutes and then enter the market in batches at the buying points, as the current buying points are all short-term trades at the 30-minute level or below.
In addition, there is a major event in the coin circle on the news front. The Franklin Ethereum spot ETF with the code EZET has been listed on the DTCC website, just like the previous Bitcoin narrative. May 23 is the decision day for the Ethereum spot ETF, and the next focus of capital speculation will probably shift to Ethereum and its ecosystem. The sudden rise of Ethereum and its ecosystem over the weekend also proved this point. It is advisable to pay more attention to Ethereum, as well as OP, ARB, STRK, SSV, and others. Look for buying points during pullbacks and position yourself in advance for medium to long-term spot trading.
If you are interested in the Chan theory and want to obtain learning materials for free, watch public live broadcasts, participate in offline Chan theory training camps, improve your trading skills, and build your own trading system to achieve a stable profit target using Chan theory techniques to timely exit at the top and buy the dip, you can scan the code to follow the public account, chat privately to obtain and add the WeChat of this account to join the group for learning!

免责声明:本文章仅代表作者个人观点,不代表本平台的立场和观点。本文章仅供信息分享,不构成对任何人的任何投资建议。用户与作者之间的任何争议,与本平台无关。如网页中刊载的文章或图片涉及侵权,请提供相关的权利证明和身份证明发送邮件到support@aicoin.com,本平台相关工作人员将会进行核查。