Daily Sharing
Yesterday we mentioned that Bitcoin is likely to have a 1-hour rebound, with rebound targets at 66000 and 67000. We also mentioned that Ethereum's 1-hour rebound should be watched at 3250, and both have reached the expected targets. The current 1-hour rebound is likely to be almost over, with a possible slight upward movement before a 1-hour pullback.
Pay close attention to the strength of the next 1-hour decline. If the next 1-hour decline does not break through 60660, it indicates that Bitcoin is likely to strengthen again.
Believe that after the pullback, Bitcoin can continue to break through 73777. Believe that the bull market for Bitcoin is not over, so do not fear short-term retracements. This pullback also provides an opportunity to continue buying, and for those without the means, it's best to hold steady until June, where there is a high probability of significant gains.
BTC
Due to the rapid changes in the market, this article can only make predictions based on the market conditions at the time of publication. Short-term players should pay attention to the latest market changes as a reference only.
1H:
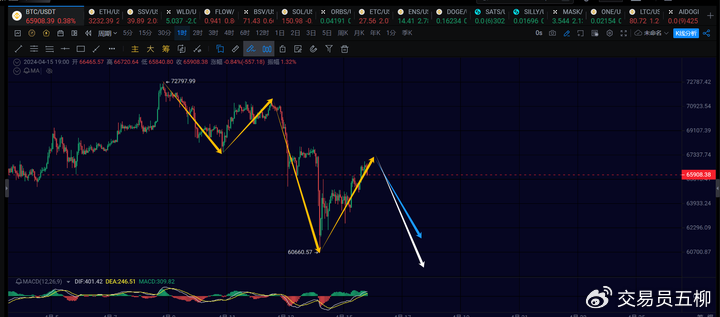
On the 1-hour chart, the fourth 1-hour rebound that started yesterday is likely to be ending soon. Short-term, watch for the fifth 1-hour decline, which could be shallow, likely not falling below 60660, such as a retracement near 61000 or 61500. A deeper decline may break below 60000.
So, pay close attention to the strength of the next 1-hour pullback. If the strength is small, it likely indicates the end of the 4-hour decline.
15M:

On the 15-minute chart, if the pullback stays above 64000, there is a possibility of further upward extension. Falling below 64000 indicates the start of the fifth 1-hour decline. For the fifth decline, watch for 61500 and 59500.
ETH

Ethereum has already seen the second 1-hour rebound in the 4-hour decline. This rebound is likely to be ending soon. If it cannot go above 3260 again, it is likely to start the third 1-hour decline. Even if it goes up again, it's likely around 3300. The third 1-hour decline is expected to break below 2852, possibly reaching around 2800. If it retraces again, it should be a very good long opportunity.
Altcoins
Currently, altcoins have experienced a significant decline, mainly because Bitcoin has risen from 30000 to above 73000. The funds in the market are still mainly in Bitcoin, and have not overflowed into altcoins. The main players make money in batches, first pumping Bitcoin, then when it's easy to sell and profit, funds will flow into Ethereum and mainstream currencies. At this stage, some funds will flow into hot currencies. After that, funds will start to rotate and speculate on different sectors.
In this process, do not assume that the inflow of funds into certain currencies will cause them to skyrocket, while others will stagnate. For example, when the main funds were only speculating on Bitcoin, many altcoins also rose, even exceeding Bitcoin's gains. However, when Bitcoin retraced, the altcoins that followed did not hold up, rising and falling quickly. Only when the main funds speculate on altcoins will they rise steadily, which is actually the main uptrend of altcoins, but currently, altcoins have not reached that stage.
Profit and loss are interconnected. Altcoins are essentially leveraged mainstream currencies. In a bull market, if you cannot accept the significant declines that occur during the pullback of altcoins, you will find it difficult to enjoy the huge profits when altcoins surge. Risk and return are directly proportional. If you want high returns, you have to accept high risks.
In terms of the current market, I believe that most altcoins are almost at the end of their pullback, or close to the end of this round of pullback. Strong altcoins may not fall below the low point on April 14. Weak altcoins may slightly break the low point and then continue to decline for a short period. However, this does not mean that altcoins will immediately surge. Altcoins can continue to oscillate at low levels.
Trend Direction
Weekly Chart: Upward direction, currently a continuation of the rebound from 15476, pay attention to the subsequent daily chart conditions for when it will end.
Daily Chart: Downward direction, currently undergoing a pullback, which is in the middle to late stage or nearing the end.
4-hour Chart: Downward direction, currently in the third 4-hour decline of the daily pullback, with attention to 59000~60000.
1-hour Chart: Downward direction, the short-term 1-hour rebound is almost over, and the focus is on the next 1-hour pullback, with a certain probability that it will not break 60660.
15-minute Chart: Downward direction, on the 15-minute chart, focus on 64000.
Feel free to follow my public account for further discussion and exchange:

This article is time-sensitive, so be aware of the risks. The above is only personal advice and is for reference only!
免责声明:本文章仅代表作者个人观点,不代表本平台的立场和观点。本文章仅供信息分享,不构成对任何人的任何投资建议。用户与作者之间的任何争议,与本平台无关。如网页中刊载的文章或图片涉及侵权,请提供相关的权利证明和身份证明发送邮件到support@aicoin.com,本平台相关工作人员将会进行核查。


