Daily Sharing
In yesterday's article, we mentioned that the decline in the 1-hour timeframe of Bitcoin has not ended and there will be a further 15-minute level decline. The focus continues to be on 64000. In the early hours of today, Bitcoin once again fell below 64000, dropping directly to 60660. Structurally, this cannot be considered a 4-hour level consolidation, but rather a pullback at the daily level.
Why is breaking 60775 considered a daily pullback? This is because the 4-hour level has already formed three consecutive up and down movements. Since the third 4-hour decline broke the low point of the first movement, it constitutes a pullback at the daily level. Will the daily pullback cause a significant drop in Bitcoin? It's unlikely. Because the current third 4-hour decline of Bitcoin is only approaching 60000, if it remains strong, once the third 4-hour pullback is completed, we will directly see a new uptrend at the daily level. If the trend is weaker, there may be at most a fifth 4-hour decline to end the daily pullback.
Therefore, the current daily pullback is basically being slowly resolved in a range-bound manner. Even if it falls below 69000 again, it will likely drop by a couple of thousand US dollars and then quickly recover.
The current daily pullback is basically in its final stage or at the 5/3 stage. If it ends a little faster, it will take more than a week to oscillate, and if it takes longer to complete the 5 movements, it will need until early May to end.
In this pullback, we can see that Bitcoin has remained quite resilient. It dropped to around 60000 in the early hours and is still able to maintain its position near 64000, confirming the bullish market trend. As for Ethereum, altcoins, and other varieties, their decline is relatively large, mainly because in this round of the bullish market, a large amount of capital has not yet flowed into them.
However, there is no need to doubt that after two or three months, altcoins will definitely surge again. I have personally experienced two rounds of bullish markets, in 2017 and 2021. I clearly remember that in the early or middle stages of each bullish market, there were always people around me repeatedly saying, "Altcoins have no market," "This is only Bitcoin's bullish market," "Altcoins basically do not rise much with the market, not selling at the high point will make you lose money." As a result, several months to half a year later, altcoins surged, and those who missed out and sold early regretted it.
BTC Medium and Long Term
Daily:
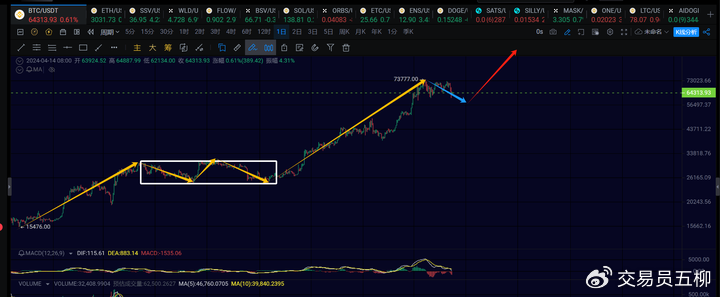
At the daily level, the current structure has undergone a new change, so today we will provide a more comprehensive analysis in advance. Since the 4-hour level has formed three consecutive up and down movements, the current view is that it is a pullback at the daily level. This means the blue arrow in the chart above represents a pullback, indicating that the uptrend of Bitcoin from 24900 to 73777 at the daily level has ended.
Starting from 15476, the uptrend from 15476 to 31000 is at the daily level. Subsequently, there was a consolidation at the daily level in the 31000-25000 range, followed by an uptrend at the daily level leaving the consolidation range starting from 24900, which directly surged and broke the historical high point.
However, since the uptrend from 24900 to 73777 is not divergent, after the current pullback from 73777 at the daily level is completed, there will definitely be another uptrend at the daily level, as indicated by the red arrow in the chart above. This is a strong three-buy within the daily level consolidation.
Therefore, the overall bullish trend of Bitcoin has definitely not ended, and it is only a matter of time before it goes above 80000. In terms of the overall trend, as long as you do not use leverage, buying spot positions in batches during the pullback and ignoring the current short-term retracement, making money in a few months is basically not a problem. With good luck, investing in good altcoins can yield 5 to 10 times returns. Of course, if you bought some spot positions at a higher level and are trapped, as long as you do not panic sell or buy low and sell high, it is basically only a matter of time before you break even and generate high profits when Bitcoin reaches 80000 again.
4H:

At the 4-hour level, the current movement is the third 4-hour decline, which broke 60775, confirming a short-term pullback at the daily level. Based on the current pullback strength, the current 4-hour level pullback is likely to end in the 59000-60500 range, and then a new 4-hour level uptrend is expected to begin. The focus is on the strength of the next 4-hour level uptrend. If it breaks 70500 again, it basically signals the end of the daily pullback and the start of a new uptrend. If it does not break, there may be a fifth 4-hour decline.
The current third daily pullback is still missing a rebound and a further decline at the 1-hour level. Patiently wait for the next 1-hour decline to observe opportunities for bottom fishing.
BTC Short Term
Due to the rapid changes in the market, the article can only provide predictions based on the market at the time of publication. Short-term players should pay attention to the latest market changes and use this information as a reference only.
1H:

At the 1-hour level, the current third 1-hour decline to around 60000 is likely to be almost completed. Short-term, watch for a rebound at the 1-hour level, with attention on the positions at 66000 and 67000. Since the third 1-hour decline is not divergent, there is likely to be a fifth 1-hour decline. The expected target for the fifth 1-hour decline is around 60000 or a drop to around 59000. Once the fifth 1-hour decline is completed, a new 4-hour level rebound is likely to begin, and the strength of the rebound should be observed at that time.
15M:

At the 15-minute level, a rebound at the 1-hour level may already be in progress. First, observe whether the current 15-minute level rebound can reach around 65600. If the second 15-minute level decline does not break 61200 (a break indicates that the 1-hour rebound has not started yet), there will be a third 15-minute level rebound.
ETH

At the daily level for Ethereum, breaking below 3000 indicates a pullback at the daily level within the second daily uptrend of the weekly uptrend. This pullback is quite significant, having already reached 30%. This is normal, as in the early stages of each bullish market, only Bitcoin is strong, rising more and falling less, and the trend is relatively stable. Ethereum and many other altcoins tend to rise and fall more, or rise less and fall more. When Bitcoin rises to a certain level and the market no longer sees it as having the value to continue increasing investment, hot money will flow into Ethereum and altcoins, causing a surge.
Personally, I expect that after this daily pullback, Ethereum will experience a trend close to doubling in the next daily uptrend, likely breaking through 4800 to reach 5000-6000 US dollars.
The overall weekly uptrend is still lacking a third daily uptrend.
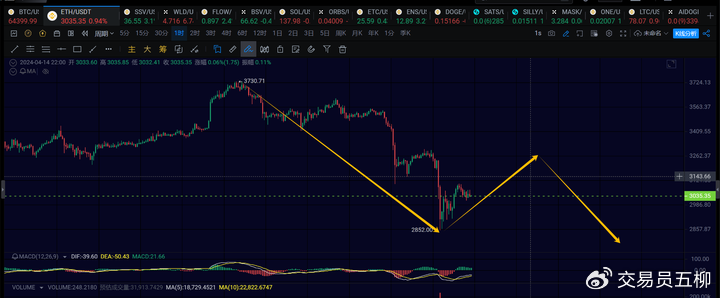
The current third 4-hour decline for Ethereum has only completed the first 1-hour decline. This 1-hour decline should be almost completed, and it is expected that there will be a rebound at the 1-hour level tomorrow. The rebound is expected to reach 3250. After the second 1-hour rebound is completed, there will be a third 1-hour decline at the daily level. The overall daily decline should be watched around 2700 and 2600. At the 15-minute level, observe whether it retraces to around 2900.
Trend Direction
Weekly Level: Upward, currently continuing the rebound from 15476, pay attention to the subsequent daily situation to determine when it will end.
Daily Level: Downward, currently undergoing a daily pullback, which is in the middle or late stage.
4-hour Level: Downward, Bitcoin is oscillating within the 4-hour consolidation and has broken below, currently in the third 4-hour decline, with support around 59000-60000.
1-hour Level: Upward, short-term focus on the 1-hour rebound, watching positions at 66000 and 67000, and there is likely to be a further 1-hour level decline back to around 60000.
15-minute Level: Downward, if it does not break 61200, it indicates a third 15-minute level rebound, and if it breaks, it suggests that the 1-hour rebound has not started yet, with support around 60000.
免责声明:本文章仅代表作者个人观点,不代表本平台的立场和观点。本文章仅供信息分享,不构成对任何人的任何投资建议。用户与作者之间的任何争议,与本平台无关。如网页中刊载的文章或图片涉及侵权,请提供相关的权利证明和身份证明发送邮件到support@aicoin.com,本平台相关工作人员将会进行核查。


