
We reminded to reduce positions and wait on April 8th, warned of the increasing risk of false breakthrough on the 10th, and predicted a significant drop before the halving on the 12th. Yesterday's article reminded not to rush to bottom fish, as a significant drop is not necessarily a black swan event! I don't care about the news, when the market goes up, it's all good news, and when it goes down, it's all bad news, including on-chain data, etc., which are just auxiliary catalysts, not fundamental.

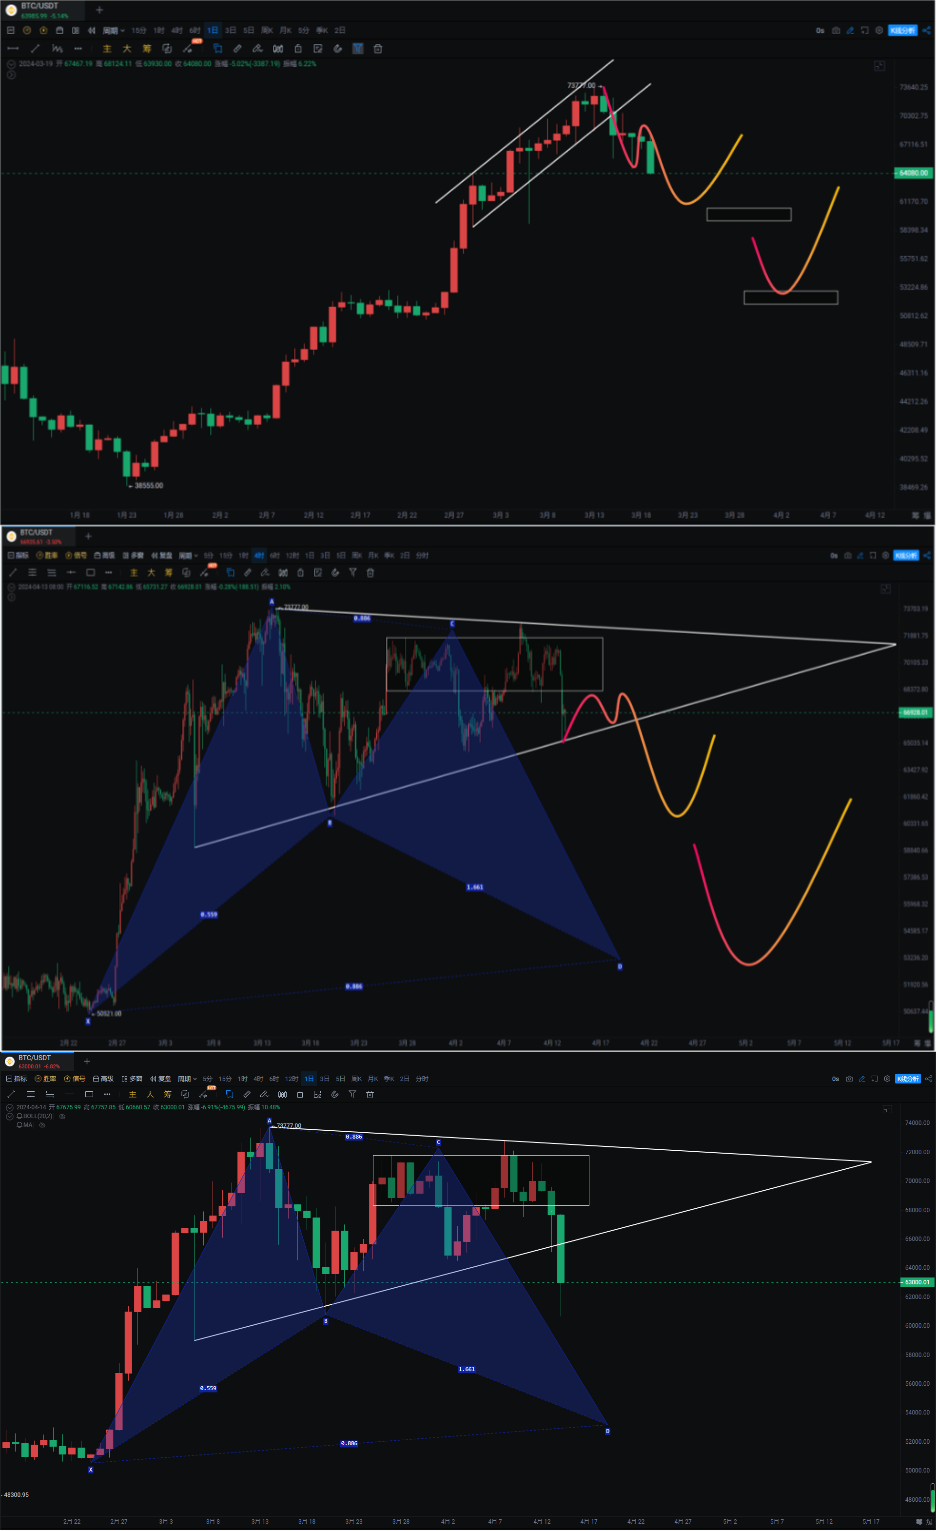
Technically, we have been reminding that high-level triangle structures are meant to be broken, and pointing out the lack of rise in the OBV indicator, indicating continuous outflow of funds. There is much more naked K-line knowledge that cannot be elaborated one by one.
The market saw a rebound near the previous low of 60660 before dropping again, with the rebound ending at 63334 at the time of writing. According to our trading plan, we are looking at the rebound height for the second bottom test. Ethereum dropped to a temporary low of 2852 and is currently at 2969.
Bitcoin
Bitcoin retested the area near 60660, and in the short term, if this support is not broken, there is a chance of a rebound with resistance at 65608. If the daily chart falls below the MA60 and then recovers, there is a chance of a rebound. If the rebound is still weak, it will continue to approach the MA120, which is 53000-56000. As for the weekly chart, it is not yet formed, but it has been oscillating in a high-level box pattern of 60600-73777, with a range of nearly 13000 points.
There is not much to say about the technical indicators. If you can't find out in advance, it's not very meaningful to look at it later. Now, it is undoubtedly all bearish. The Hong Kong ETF is expected to be launched next week, and there is an expectation of a small rebound. According to our trading plan, when the market falls rapidly, I generally do not mention altcoins. If I find a good opportunity, I may also participate.
Ethereum
The perfect arrival of the downward C wave after breaking the descending triangle and falling below the previous low of 3056. The weekly chart's double negative sandwiched between two positives has played a role, and the situation on the weekly chart will be analyzed again tomorrow. Previously, we predicted a return to the range of 2600-2800, and the drop to 2852 is also very close.
According to our bottom-fishing plan, we will gradually lay out positions for medium- to long-term trading as the daily chart retraces to the MA120. If 2852 is broken, it will come out first (the exchange rate has issued a danger signal). Previously, it followed the descending triangle of 3056 and 3678, and it has temporarily broken through. If 3056 to 3678 is considered as the downward B wave, then the C wave decline has just begun if it cannot recover 3056. The adjustment at the weekly chart level may require more time. There are also some negative signals for ETH/BTC, which will be discussed in detail tomorrow.

If you like my views, please like, comment, and share. Let's go through the bull and bear markets together!!!
The article is time-sensitive and is for reference only, with real-time updates.
Focusing on K-line technical research, for a win-win global investment opportunity, follow the public account: 交易公子扶苏 (Trading Prince Fusu).

免责声明:本文章仅代表作者个人观点,不代表本平台的立场和观点。本文章仅供信息分享,不构成对任何人的任何投资建议。用户与作者之间的任何争议,与本平台无关。如网页中刊载的文章或图片涉及侵权,请提供相关的权利证明和身份证明发送邮件到support@aicoin.com,本平台相关工作人员将会进行核查。


