Daily Sharing
In yesterday's market analysis, we faintly felt that the market was very weak, so last night's article gave some key points. Last night, we said that if Bitcoin falls below 69600, it may undergo a 1-hour level pullback. We also provided relevant opinions on the intensity of the 1-hour level pullback. If the 1-hour level pullback falls below 67800, it is highly likely to further slide towards 64000 or 61000, and it can only continue to rise if it stays above that level.
In fact, last night, Bitcoin dropped directly, and in the early morning, it plunged to 65000, indicating that the overall 4-hour level upward trend of Bitcoin did not successfully emerge. Currently, it is still oscillating between 61000 and 72000.
From the current market perspective, Bitcoin's repeated oscillation has not shown a clear downward trend. Therefore, it is believed that as long as it effectively stays above 60775, Bitcoin should still be viewed as oscillating within the 4-hour range until it eventually breaks through to a new high to complete the daily level rise. If it falls below 60775, it can be considered a daily level pullback, but overall, it is still relatively strong.
Currently, there is a phenomenon in the market where Bitcoin is oscillating within a range, while altcoins continue to decline. With Bitcoin's recent sharp drop, altcoins have collectively collapsed. People can't help but ask, is the altcoin market normal in a bull market?
In previous bull markets in the cryptocurrency industry, this phenomenon is very normal. For example, in 2016-2017 and 2020-2021, after Bitcoin broke its historical high, many altcoins were still oscillating at the bottom, and when Bitcoin sneezed, altcoins directly collapsed. Ethereum, known as the second in the cryptocurrency market, has shown relatively weak performance in the early stages of previous bull markets. This is because in a bull market, generally, the early funds are concentrated in Bitcoin. From the market value proportion of Bitcoin, it can be seen that Bitcoin's market value proportion has reached a new high in nearly 3 years, indicating that the market's funds have not completely shifted to altcoins.
Funds are profit-driven. When Bitcoin reaches a certain height and the market believes its price is too high, a large amount of funds will flow into altcoins to profit. So from this perspective, it is still early in the bull market. Looking at the weekly structure of Bitcoin, it is still too early to say that the bull market is over. Because Bitcoin still needs to undergo at least one daily level decline and one daily level rise, so from a medium to long-term perspective, the current prices of most potential cryptocurrencies are still in the bottom area, and there will be opportunities to reach higher positions in the future.
BTC
Due to the rapid changes in the market, the article can only make predictions based on the market changes at the time of publication. Short-term players should pay attention to the latest market changes and use the article as a reference only.
1H:
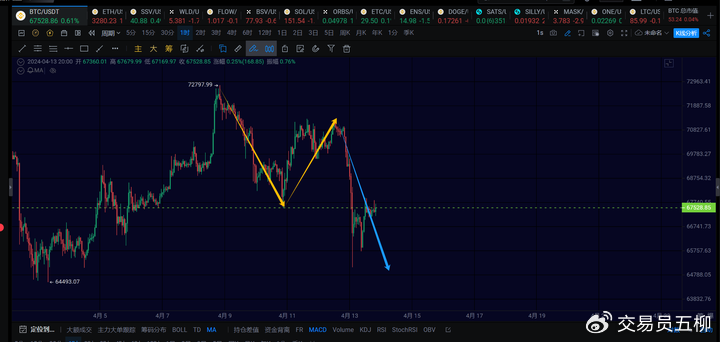
At the 1-hour level, since the expected third 1-hour level rise did not break through 72797, the 4-hour level rise did not succeed. Therefore, we can only observe the short-term 1-hour level trend. Currently, it is undergoing the 1-hour level pullback from 71227 yesterday, and this pullback is expected to have one more 15-minute level decline. So, the 1-hour level decline here has not ended yet, and attention should continue to be paid to 64000 below.
The focus is on the strength of the next 1-hour level rebound, to see if there will be a small-to-large V-shaped market reversal.
Here's an aside:
From the current market situation, Bitcoin's trend here is not bad, it is still very strong overall, and the current downward trend is not too strong, belonging to the category of large range oscillation, and it is important to note that the market tends to quickly form a bottom and V-shaped reversal. In comparison, the overall performance of altcoins is indeed relatively poor, so it is best not to aggressively leverage altcoins, as they are likely to incur significant losses in a bull market. For those stuck in altcoins, holding spot positions for a few months can generally break even and generate profits, but with altcoin contracts, being taken out in one fell swoop is highly probable.
15M

At the 15-minute level, it is normal to need to undergo another 15-minute level decline, and attention should be paid to whether it will retest 65000, and if 65000 cannot hold, then look at 64000. It is expected that the short-term retracement will not be too deep, and the early morning drop basically falls within the target area of the 1-hour level decline.
It will only be possible to see a V-shaped reversal if it re-breaks through 68500. Otherwise, there will still be another 15-minute level decline to retest the low point.
ETH

In last night's article, we mentioned that if Ethereum falls below 3410, it is highly likely to retest the vicinity of 3000, and the lowest has now reached around 3100. Currently, it continues to oscillate within the range of 3100 to 3700, and the current structure still needs to be observed, temporarily also belonging to the category of 4-hour level oscillation.
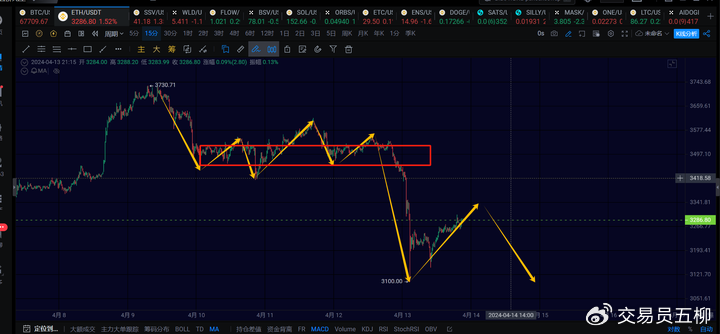
At the 15-minute level of Ethereum, due to the absence of a 15-minute level decline in the departure section of the 15-minute level, there is likely to be another 15-minute level retracement to around 3150 or even 3050.
To see a direct V-shaped reversal from the 1-hour level to the large level, the price needs to re-break through 3410. Otherwise, it is still possible to continue to retest the low point.
Trend Direction
Weekly Level: Upward, currently it is the continuation of the weekly rebound from 15476, and the end time will depend on the subsequent daily level situation.
Daily Level: Upward, the upward target on the daily level needs to be adjusted, looking at around 76000 or 80000.
4-hour Level: Oscillating, the 4-hour level rise has not successfully emerged, so it continues to oscillate within the range of 61000 to 72000, until it ultimately chooses a direction, either effectively breaking through the upper edge or effectively falling below the lower edge.
1-hour Level: Downward, the 1-hour level pullback may not have finished yet, and attention should be paid to 65000 and 64000 below.
15-minute Level: Downward, if it does not break through 68500, there will still be another 15-minute level decline to retest the low point.
Feel free to follow my public account for discussions and exchanges:

The article is time-sensitive, so be mindful of the risks. The above is only personal advice and is for reference only!
免责声明:本文章仅代表作者个人观点,不代表本平台的立场和观点。本文章仅供信息分享,不构成对任何人的任何投资建议。用户与作者之间的任何争议,与本平台无关。如网页中刊载的文章或图片涉及侵权,请提供相关的权利证明和身份证明发送邮件到support@aicoin.com,本平台相关工作人员将会进行核查。


