
昨晚发出分析快11点多,盘面还在70000附近徘徊我们提醒的是24/04/12BTC短线上下插针,咫尺压力始终无法突破,减半期间大幅下跌必来?今天最低打到65000。一周左右的时候大饼跌去10%,以太我们说只要一日不能突破3678这个价格潜在C浪下跌无法避免,几天时间跌去16.9%。山寨更不用说弱势的跌去30—50%。
4月8号提醒BTC减半倒计时12天,收敛三角下方承压,减仓观望等待抄底机会!4月10号提醒BTC收敛三角假突破,减半前风险不断增加,等待中长线布局机会?也提醒过回补缺口68000—69000,后反弹71305承压,之后继续下跌。
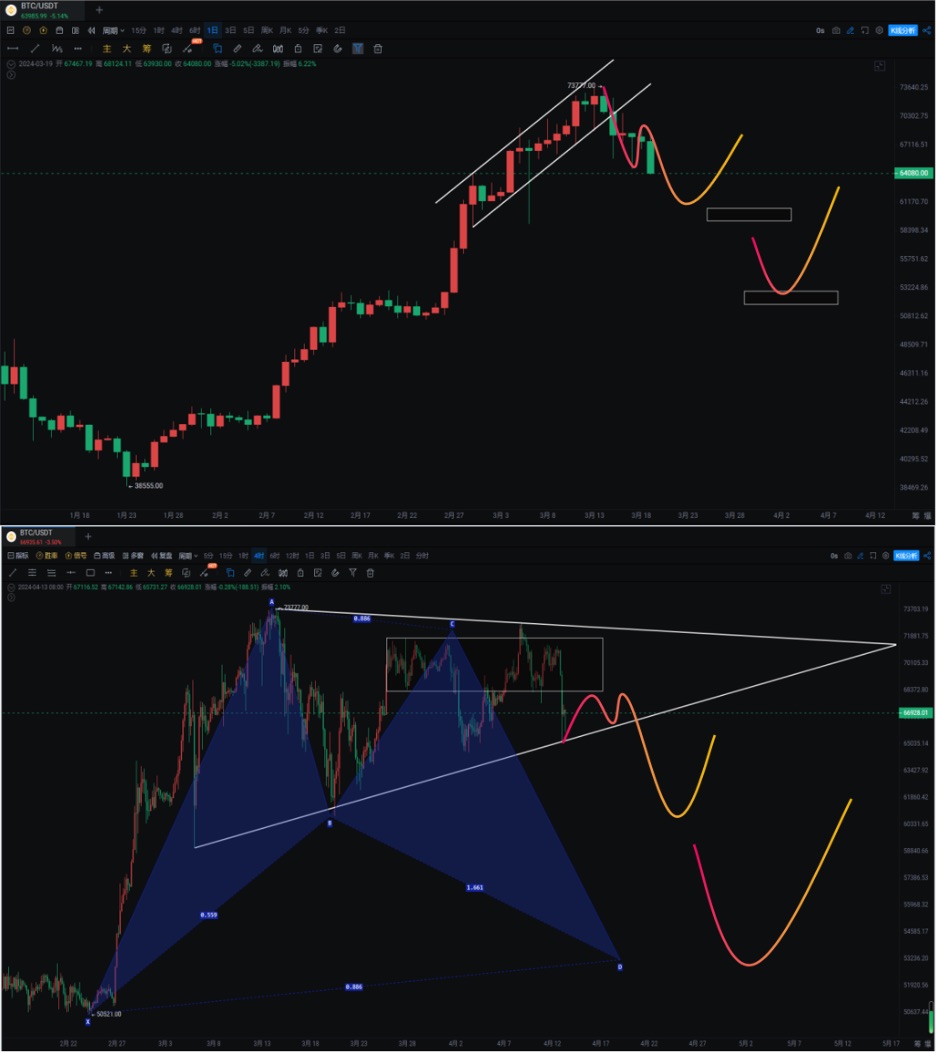
大饼出现多重顶高点不断降低,此前低点不断抬升,而且出现假突破等想象,是抄底机会还是继续下跌?我的观点是继续等待不着急抄底。是否会出现黑天鹅事件,在我看来就算继续下跌跌破60000看到53000都是正常回调,但是对于很多看不懂的人或者无良媒体肯定会报到为黑天鹅。我们的抄底计划此前也提醒过按照计划进行就行。以太我们看的更低。

大饼
高位三角都是用来跌破而不是突破,昨天也对历史高位阶段做出分析。跌破后的反弹才是我们要考虑的入场机会。价格线一直围绕MA20震荡靠近MA60,第一抄底机会在60775—63000头仓,第二抄底机会53000—56000二次加仓。空间范围比较大只适合现货。我们也一直是玩现货,不要拿我们的思路抄底合约,需要更精确的位置。
日线MACD一周前就出现底背离但是盘面没有有效突破高点,现在水下漏油风险加大快慢线继续拐头向下,OBV指标黄线拐头向下白线同样下穿黄线,资金持续流出,ETF本周是负流入状态。从1月11日到3月29净流入121.32亿而29日至今才3亿左右。
4小时跌破箱体反弹不能收回68300则形成二次确认价格将滑向60000,而4小时完美看涨蝙蝠形态则在53000,同时这里也是日线MA120和周线MA20重合位置。
支撑:
压力:
以太
日线下降三角跌破最低触及3100,下跌C浪开启如果按照等幅度下跌价格看向2600—2800。MACD底背离上穿零轴4天还是被带下来,OBV指标就从来没有资金流入的状况。日线唯一支撑3056和唯二支撑2872周线M A20支撑2789。周线下跌中的双阴夹阳3056恐怕支撑不住。
4小时跌破下降三角反弹测试三角下沿不能收回则有机会继续下探。
支撑:
压力:

如果你喜欢我的观点,请点赞评论分享,我们一起穿越牛熊!!!
文章具有时效性,仅供参考实时更新
专注k线技术研究,共赢全球投资机会公众号:交易公子扶苏

免责声明:本文章仅代表作者个人观点,不代表本平台的立场和观点。本文章仅供信息分享,不构成对任何人的任何投资建议。用户与作者之间的任何争议,与本平台无关。如网页中刊载的文章或图片涉及侵权,请提供相关的权利证明和身份证明发送邮件到support@aicoin.com,本平台相关工作人员将会进行核查。


