
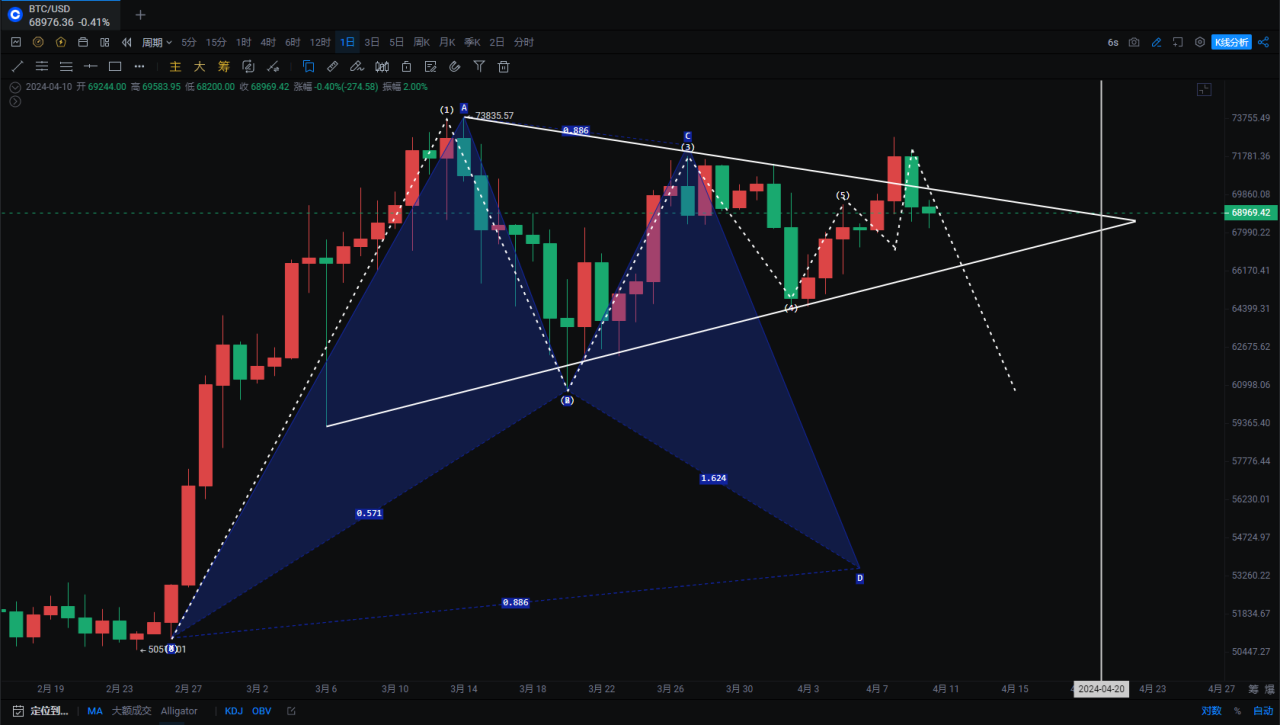
24/04/08BTC减半倒计时12天,收敛三角下方承压,减仓观望等待抄底机会!
昨天的分析中也提醒有机会回补68000—69000缺口再看反弹力度最低插针至68210但目前反弹力度还是偏弱,收敛三角假突破减半前风险不断增加,等待中长线布局机会?
国际资本大举做空日元,日元逼近近34年来的低点,已接近日本财务省可能干预线152,日元做空程度已经堪比金融危机前夕。韩元、瑞士法郎、印尼盾等其他非美货币也面临着较大的贬值压力。分析人士指出,这背后的主要原因或许是,美元的持续走强以及美联储降息预期暴跌。不知道大家还记不记得(24/03/22BTC强势反弹后的回踩,4小时潜在头肩底形态,美元指数面临变盘仍需谨慎!)一文说过这个观点漂亮国趁着美联储降息前搞事情再收割一波,现在就看到新闻了。
最近黄金涨幅已经吸引国内消费者投资者关注,内地连续17个月增持黄金储备,但是普通消费者购买已经被限制,那就来买BTC吧。时间周期拉长数字黄金收益肯定高于黄金。

大饼
大饼收敛三角假突破,日线已经形成强卖信号,8号我们提醒过逢高减仓,观望等待抄底机会,刻舟求剑来看17年高点,19年,20—21年高点都是一样的三角格局最后都是回落。我没有说现在就转熊了,我一直是多头,只是现阶段风险大于机会该规避还是规避。
日线走出新的三角格局,价格处于前箱体68210—72797内部震荡,暂时箱体底部仍有支撑。跌破就会到66000附近,继续向下就看60000。MACD底背离始终没有翻上零轴水下漏油,快慢线向下,OBV指标黄线拐头向下RSI指标触碰超买区拐头向下。此前我们画过一个完美看涨蝙蝠形态就是看到53500,这也是我们预判的抄底机会一个60000附近,还有就是53500附近。
支撑:
压力:
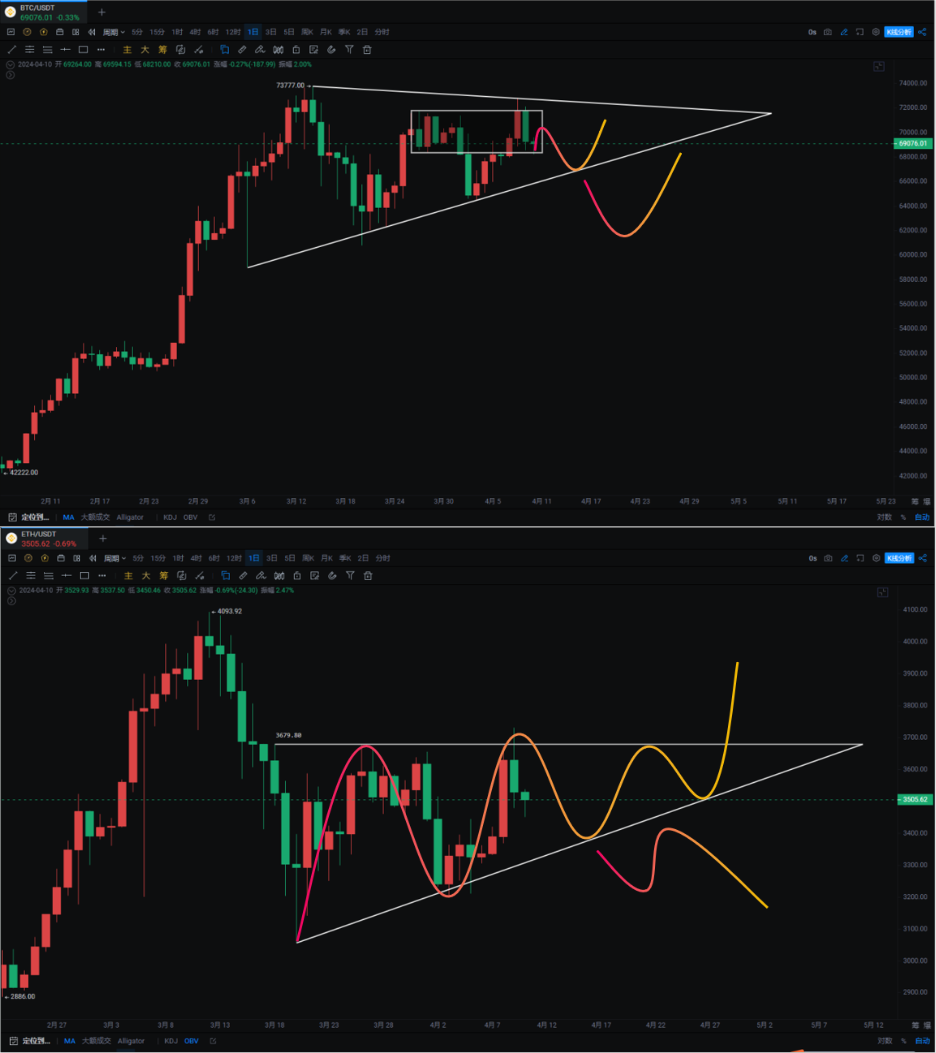
以太
以太也没给到大家太多惊喜向上刺穿3678后跌回重新回到三角格局,高点受限只能继续三角震荡或者再测试3000—3200支撑。OBV指标反弹不过黄线资金仍是流出状态。MACD回到零轴上方警惕被大饼带下来,周线裸K上看还有一跌。记住这个观点逻辑汇率反弹以太山寨补涨大饼必须出新高才能化解危机。山寨补涨行情还不算完全走完把握好山寨即可。
支撑:
压力:
如果你喜欢我的观点,请点赞评论分享,我们一起穿越牛熊!!!
文章具有时效性,仅供参考实时更新
专注k线技术研究,共赢全球投资机会公众号:交易公子扶苏

免责声明:本文章仅代表作者个人观点,不代表本平台的立场和观点。本文章仅供信息分享,不构成对任何人的任何投资建议。用户与作者之间的任何争议,与本平台无关。如网页中刊载的文章或图片涉及侵权,请提供相关的权利证明和身份证明发送邮件到support@aicoin.com,本平台相关工作人员将会进行核查。


