Click to watch the video: https://www.bilibili.com/video/BV1hJ4m1V7Fq/?vd_source=04332ad6ecefd22ffa3d1b9032b40fb3
So in today's video, let's predict the peak of Dogecoin, or in January this year, I told everyone that Dogecoin could be bought around 0.08. Up to now, Dogecoin has risen by nearly 2 times. I also hope everyone can continue to hold the long position's profits. Later, we will also discuss the peak of Dogecoin, including the long position profits of Bitcoin last year, which I am also continuing to hold. Yesterday, Bitcoin once again broke through 72000, but the price retraced. Later, we will also discuss the short-term trend of Bitcoin.
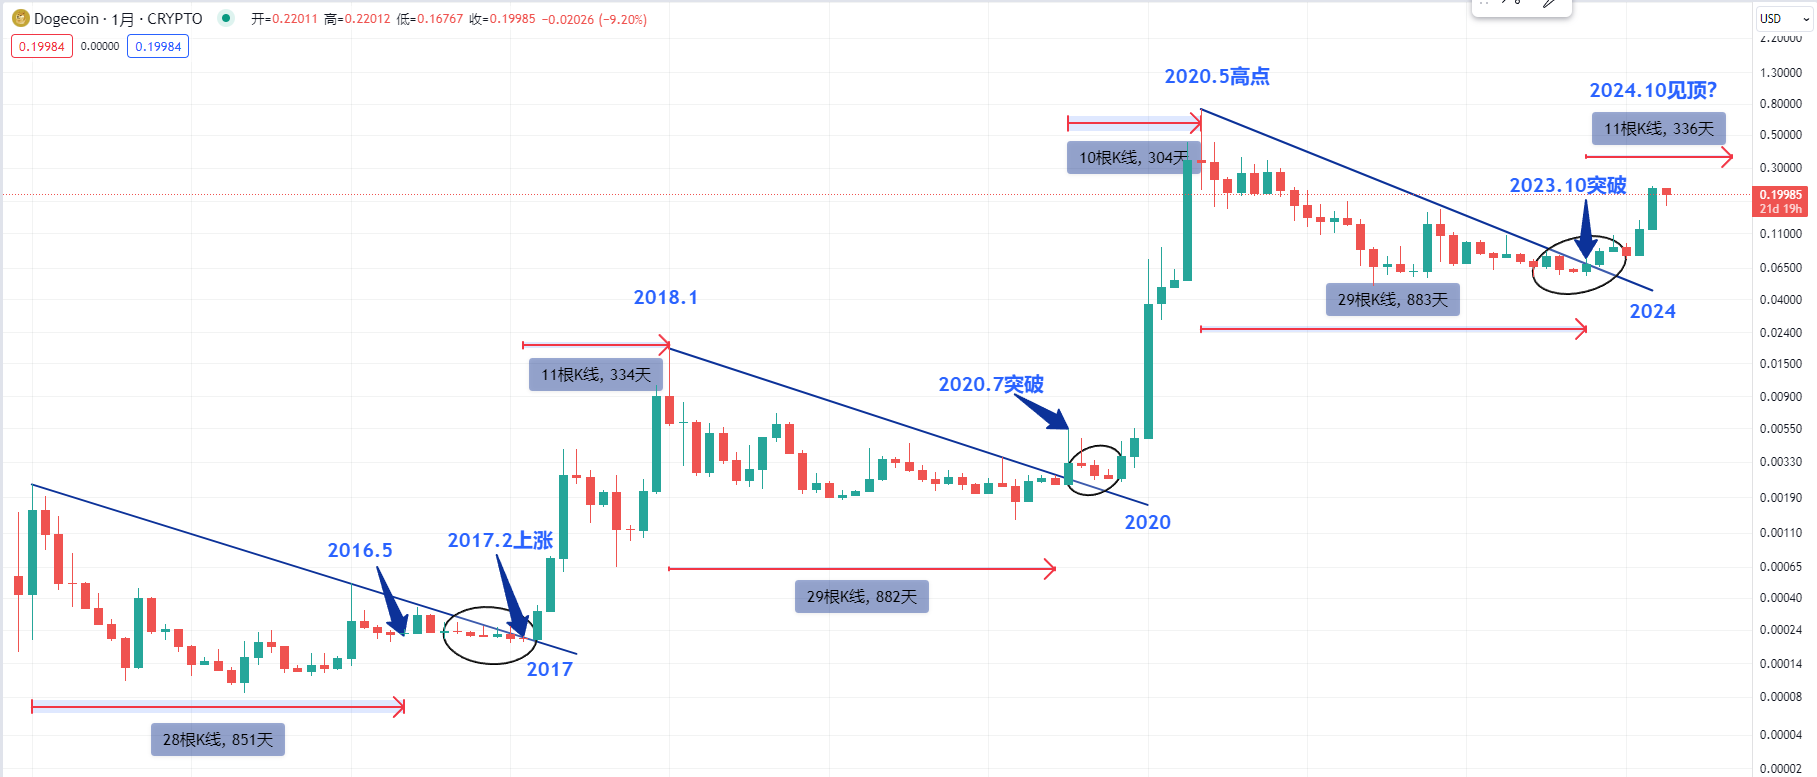
Let's first look at the monthly chart of Dogecoin. I have found that in history, Dogecoin's bottom breakthrough time generally approaches 29 months. We can observe that from the high point of Dogecoin in May 2021 to the position of these high points, there is a downward trend, and then it broke through in October 2023.
From the breakthrough candlestick to the position of the previous high point, the time is 29 months. We can also see that from the breakthrough candlestick of Dogecoin in 2020 to the position of the previous high point, it is also 29 months. Or when Dogecoin hit bottom in 2017, from May 2016 to the position of the previous high point, the time was also close to 28 months.
So we can think about whether there is a pattern in the peak of Dogecoin from some historical phenomena. In addition, I have also noticed a phenomenon, that is, if Dogecoin breaks through the bottom trend, its rise will generally be very steep, including the steep rise in this position in 2017.
We can observe that from the breakthrough candlestick in July 2020 to the high point in May 2020, Dogecoin's rise lasted nearly 10 months. Then we can see that from the start of the rise of Dogecoin in 2017 to the high point in January 2018, the time was 10 months. So let's take a look at the current trend of Dogecoin. In fact, there is not much room for further rise at the moment.
So if we calculate from the breakthrough candlestick in October 2023, if the rise lasts for 11 months, it will be around October 2024, which means we need to pay attention in October this year to see if Dogecoin has reached its peak. However, we also need to consider the space, because I have mentioned in the video before that if it really reaches $1 or has historical large rise space, then we should consider selling part of the spot at the high point.
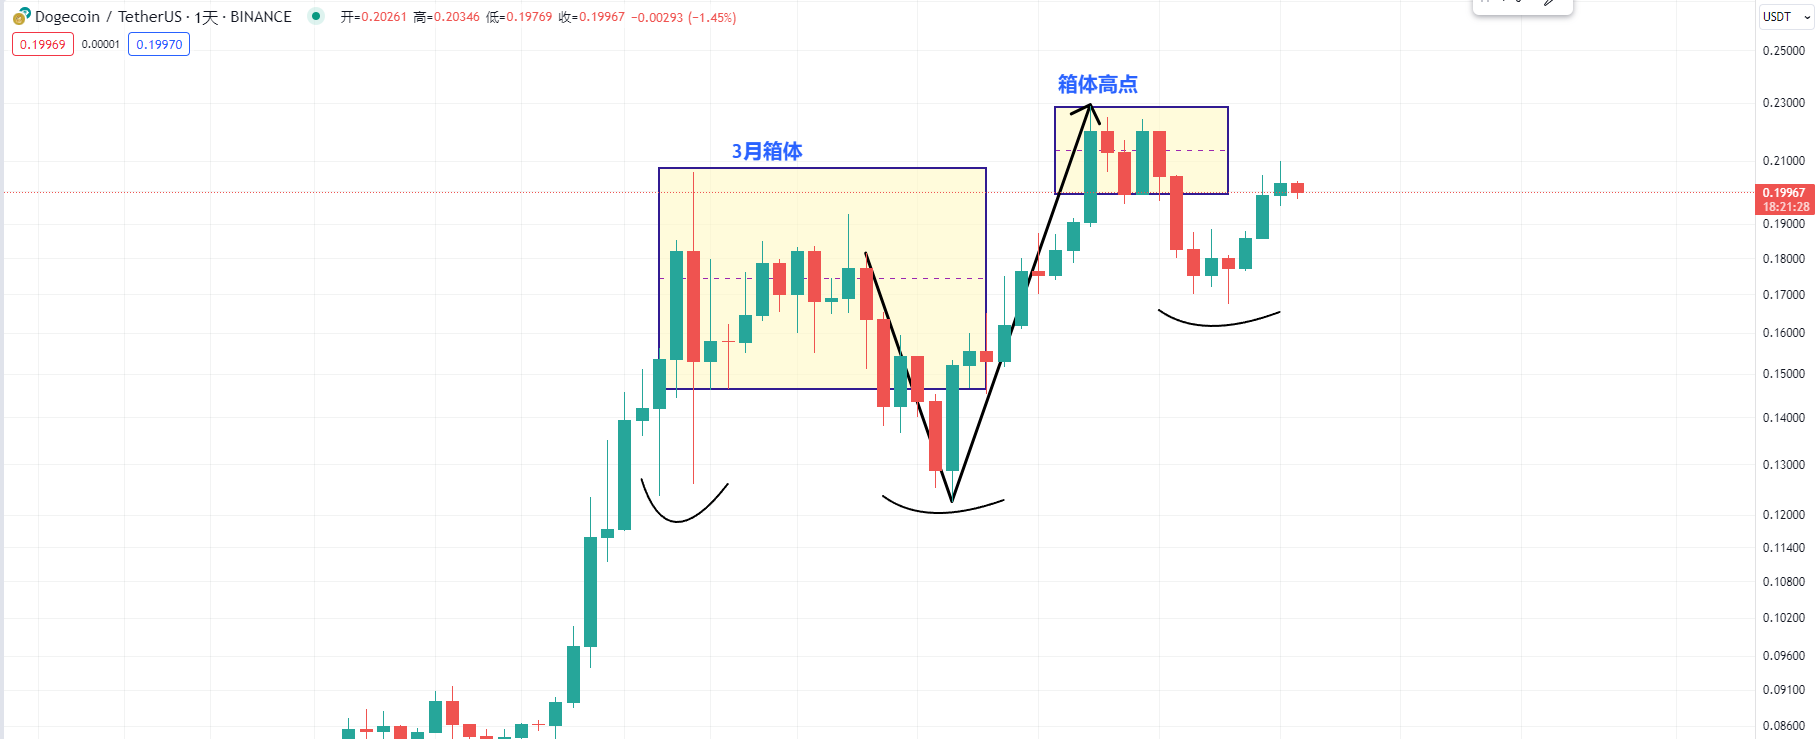
Next, let's take a look at the daily chart of Dogecoin. In the past few days, Dogecoin has already broken through the low point of this range and has now returned to this range. So if Dogecoin rises too much in the short term at this position, it may consolidate. It is currently in a strong area, so I expect that after consolidating for a period of time at this position, there is hope to continue to break through the high point of the previous range.
Because according to the experience of range patterns, for example, in the range in March, as long as this position is broken and can return to the range, it will generally break through the high point of the range. And the current range is digging downwards, and now it has returned to this range. My view is that it is definitely going to break through the high point of this range in the near future.
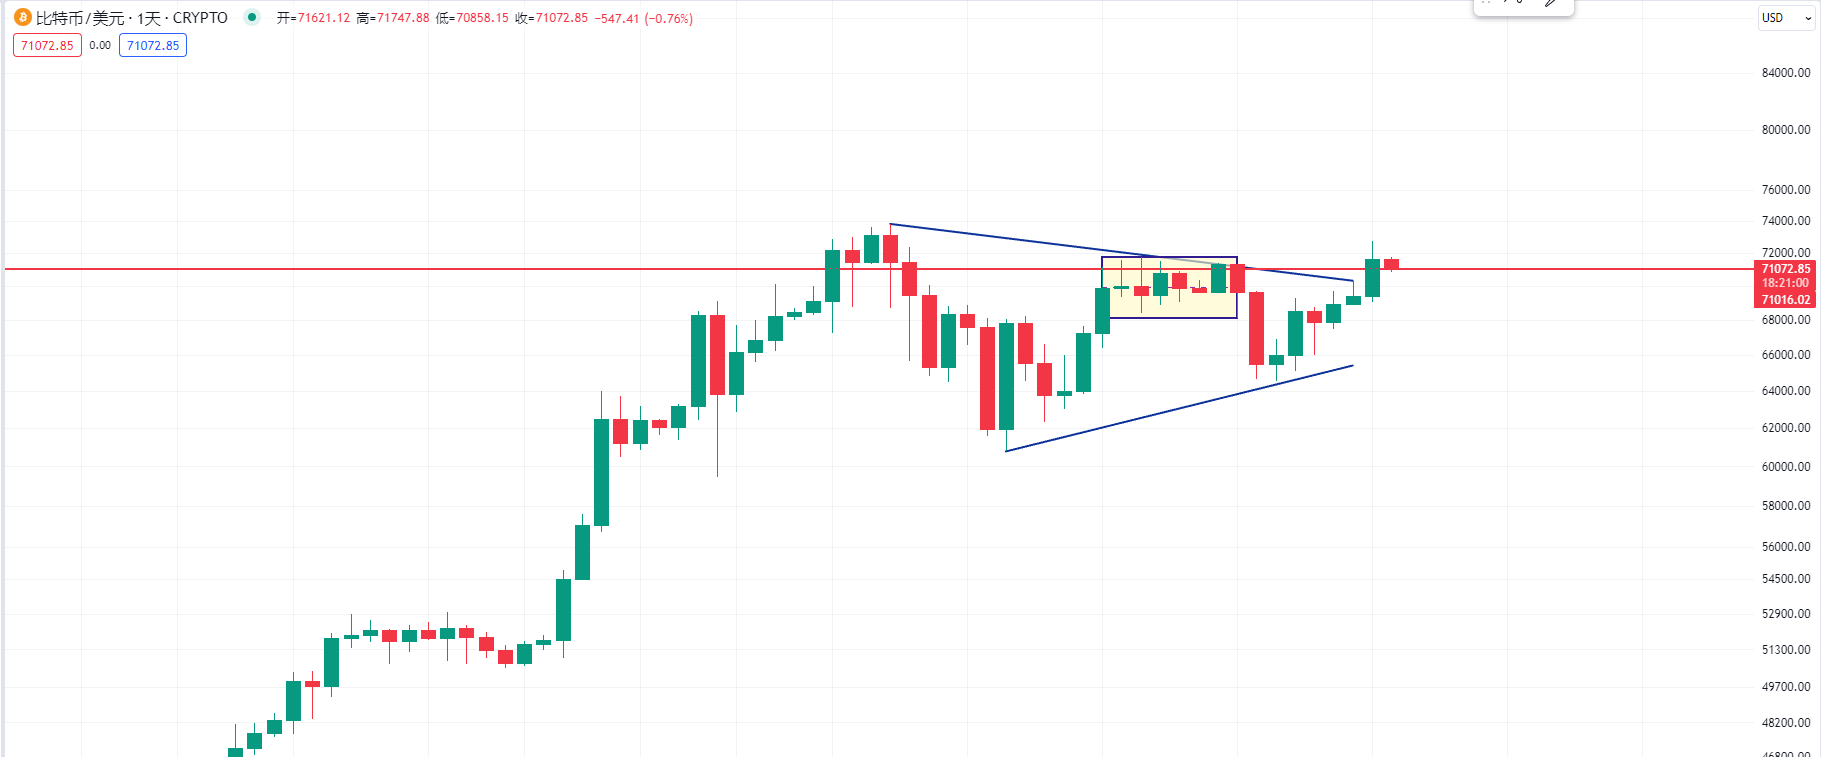
Next, let's take a look at the daily chart of Bitcoin. Yesterday, Bitcoin's rising candlestick broke through the previous converging triangle. So now at this position, we need to consider the intention of the main force.
If it is a breakthrough with a large rising candlestick, the intention at this position must be more obvious and cannot stay at this position. We need to pay attention to about three days, it cannot be too late. We must quickly continue with another large rising candlestick. Because we can observe that at this position of the converging triangle or the high point in the previous range, there is also a turning point.
My view is that the intention of the main force must be more obvious. They must quickly come up with another rising candlestick. If it doesn't rise, at the low point this morning or in the rising candlestick yesterday, if there is an upper shadow, we need to pay attention that it cannot return to the bottom of the previous range, which is 71000 and cannot be broken in the short term.
Because we can observe that at the previous low point, there is also a similar pattern, including when Bitcoin was at this position in December 2023, there was also a trap. After a few days of digging, it returned to this range. Or we can also look at a relatively small range.
For example, when it was at the bottom of 25000, I told everyone to buy the dip, because if it falls below the low point of the range, the intention of the main force will be more obvious. If it is really a bear market, it must quickly fall below this position. After Bitcoin's price rose to this side, there was also a relatively small range at 26000. After breaking through this range, the bull market returned.
So the current position is like the reverse of the pattern at the low point from 25000 to 26000 before. The critical position of the current range is 71000. We need to pay attention that Bitcoin cannot return to 71000.
If the intention of the main force at this position is very obvious, that is, they want to continue to attack to 80000 or 100000, then in the short term, they should continue to push up at this position. Only then can we determine that the mid-term consolidation period of Bitcoin has ended. The main force must launch a large-scale attack at this position to continue to reach higher prices.
This article is exclusively planned and published by Master Chen (WeChat public account: Coin God Master Chen). If you need to learn more about real-time investment strategies, how to get out of a predicament, spot contract trading techniques, operation skills, and candlestick knowledge, you can add Master Chen for learning and communication, and follow for free. I hope it can help you find what you want in the currency circle. Focusing on BTC, ETH, and altcoin spot contract trading for many years, there is no 100% method, only 100% going with the trend; daily updates on macro analysis articles across the network, technical indicator analysis of mainstream coins and altcoins, and spot mid-to-long-term replay price prediction videos.

Friendly reminder: Only the column public account (as shown above) is written by Master Chen. The end of the article and other advertisements in the comment area are not related to the author. Please distinguish carefully between true and false. Thank you for reading.
免责声明:本文章仅代表作者个人观点,不代表本平台的立场和观点。本文章仅供信息分享,不构成对任何人的任何投资建议。用户与作者之间的任何争议,与本平台无关。如网页中刊载的文章或图片涉及侵权,请提供相关的权利证明和身份证明发送邮件到support@aicoin.com,本平台相关工作人员将会进行核查。


