点击观看视频:https://www.bilibili.com/video/BV17m421E7Px/?vd_source=04332ad6ecefd22ffa3d1b9032b40fb3
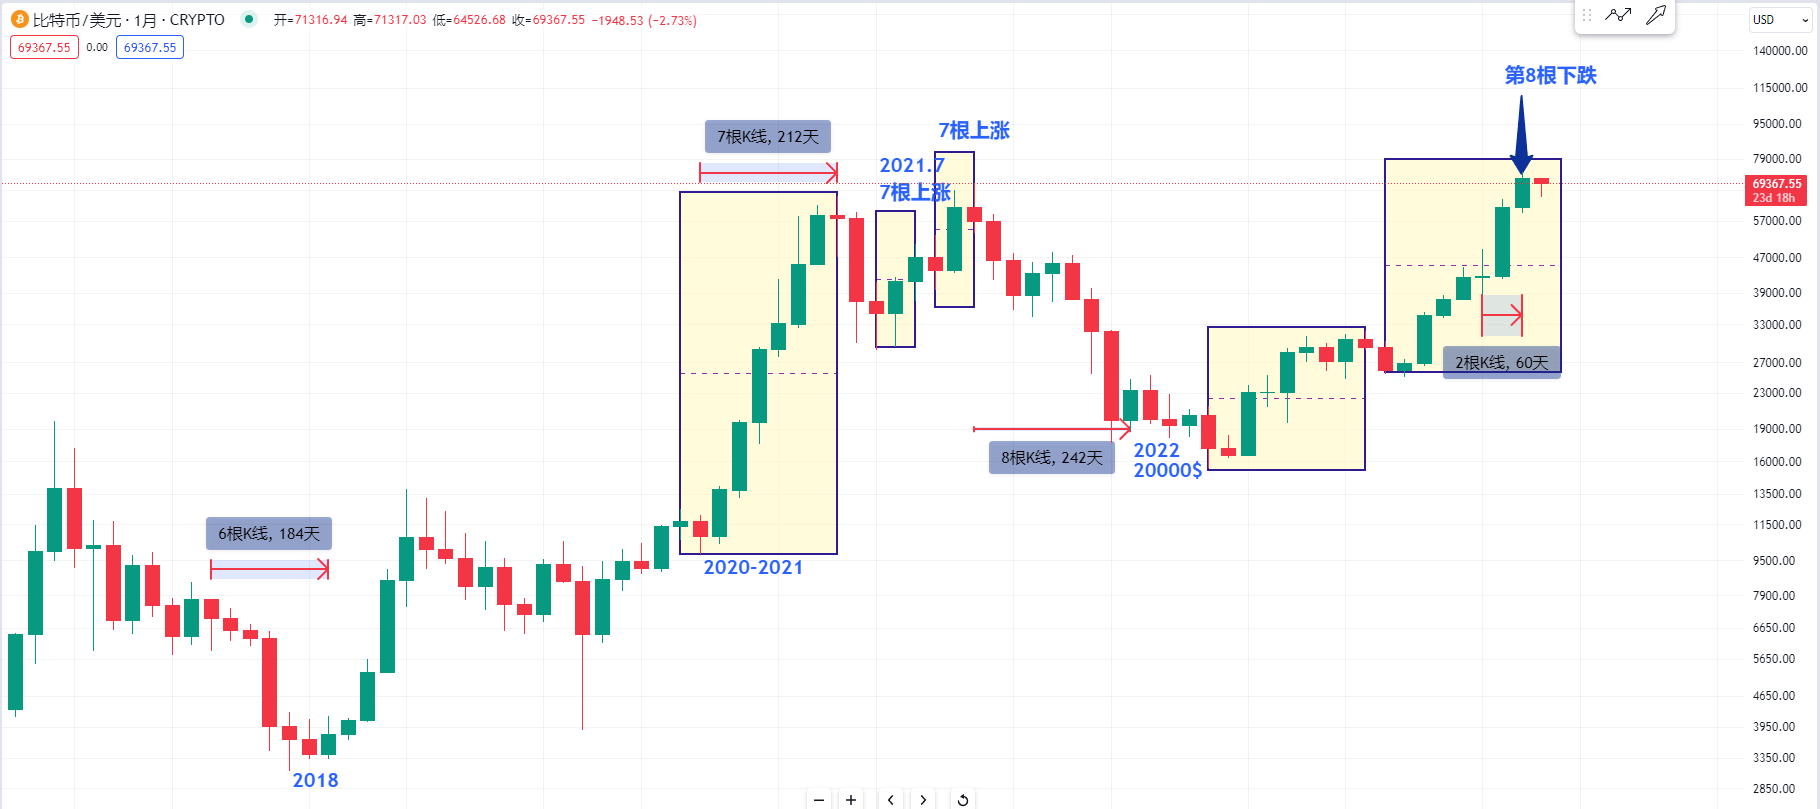
我们先来看一下比特币的月线级别 那么我在之前的视频里面也有提到过 目前整个市场都看得懂比特币在月线级别里面目前已经是连续涨了7个月 在2022年当时2万的底部我为什么告诉大家可以去抄底 也是因为一般在月线级别里面如果有连续下跌的6根K线
那我们可以观察一下当时从高点跌到了2万的底部 在这个位置是跌了8根K线 然后我们可以去参考一下比特币在2018年的熊市 他在这个位置也是跌了6根左右的K线 或者我们可以观察一下比特币在2020年到2021年这一波上涨的历史 这个位置是上涨了7根K线 后面比特币就有一个下跌 包括比特币当时在这个上涨69000的顶部

我们可以观察一下他的周线级别 当时为什么在69000的顶部告诉大家可以去做空 我们可以观察一下在周线级别里面不一定必须要7根上涨就要注意风险 或者是连续7根下跌就要开始抄底 我们可以观察一下在中间可以夹杂着1到两根下跌K线
我们从低点开始计算就是连续上涨了7根K线 那么中间是有两根下跌K线也是可以接受的 包括当时在2021年的7月份 比特币涨到了这个高点 其实这里面的K线也是在7根左右 中间夹杂着1根下跌K线也是可以接受的
那么目前的比特币我是有发现了他不光是在月线级别里面已经连续上涨了7根K线 而且我们可以观察一下为什么这个高点的位置在这边有一个转折 74000到目前都还没有突破 我们同样可以数一下在周线级别里面的K线 第8根这个位置的高点目前是有一个短线的转折
那现在会不会在这个位置下跌我心里也没有底 但是在目前的这个位置做多你就要看看在月线和周线里面都是连续涨了7根 那么你在中长线上面的操作就需要注意了
所以在月线级别和周线级别里面的K线 比特币都是连续上涨了7个月 如果要继续进场做多或者是买入现货的话还是要小心 因为目前还不是时候 那我自己也在最近也只会参与短线交易
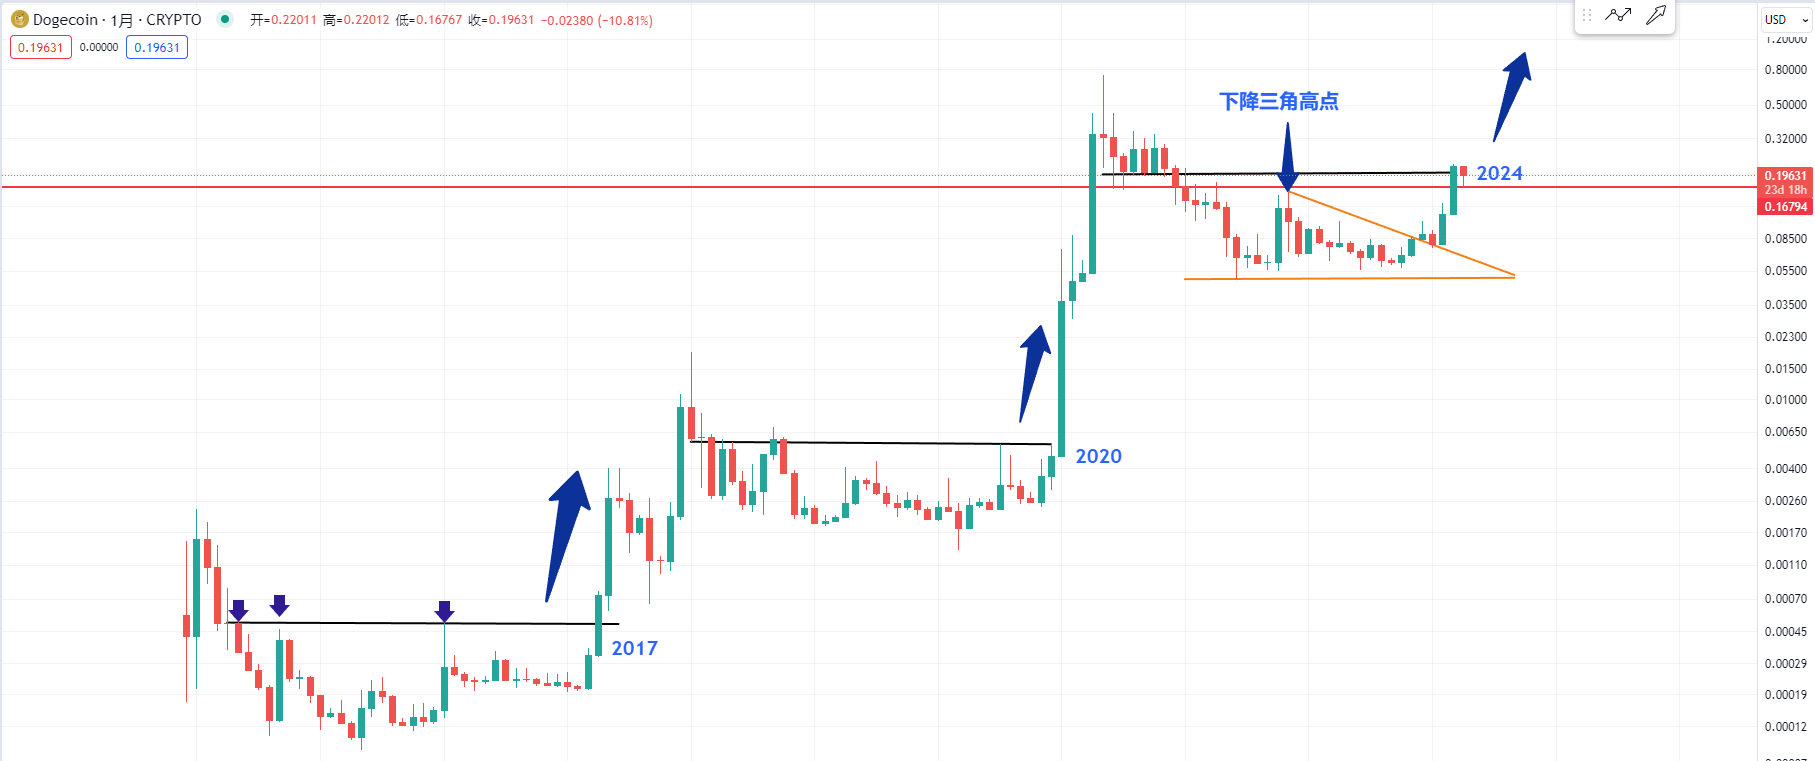
然后我们来看一下狗狗币的月线级别 那么在前面我也是有在视频里面讲过 目前的这两根K线上涨就像我是在2020年的这两根K线一样 目前我依旧认为只要比特币不下跌 那么在这个月狗狗币就有希望去突破历史新高
这几天下跌的是在0.16附近 同时也是非常接近狗狗币在前面这个下降三角高点的位置 那我们可以观察一下在2020年的这个位置也是有比较大的波动
不过我们也可以观察一下在2017年当时的狗狗币 也是连续有两根上涨 那么第三根的回撤K线他也是在月线里面有下影线的低点 同时也是在测试这几个高点的位置
所以只要比特币没有深幅的下跌 狗狗币的月线就有可能会像这个位置2017年的这一根K线一样去突破历史新高
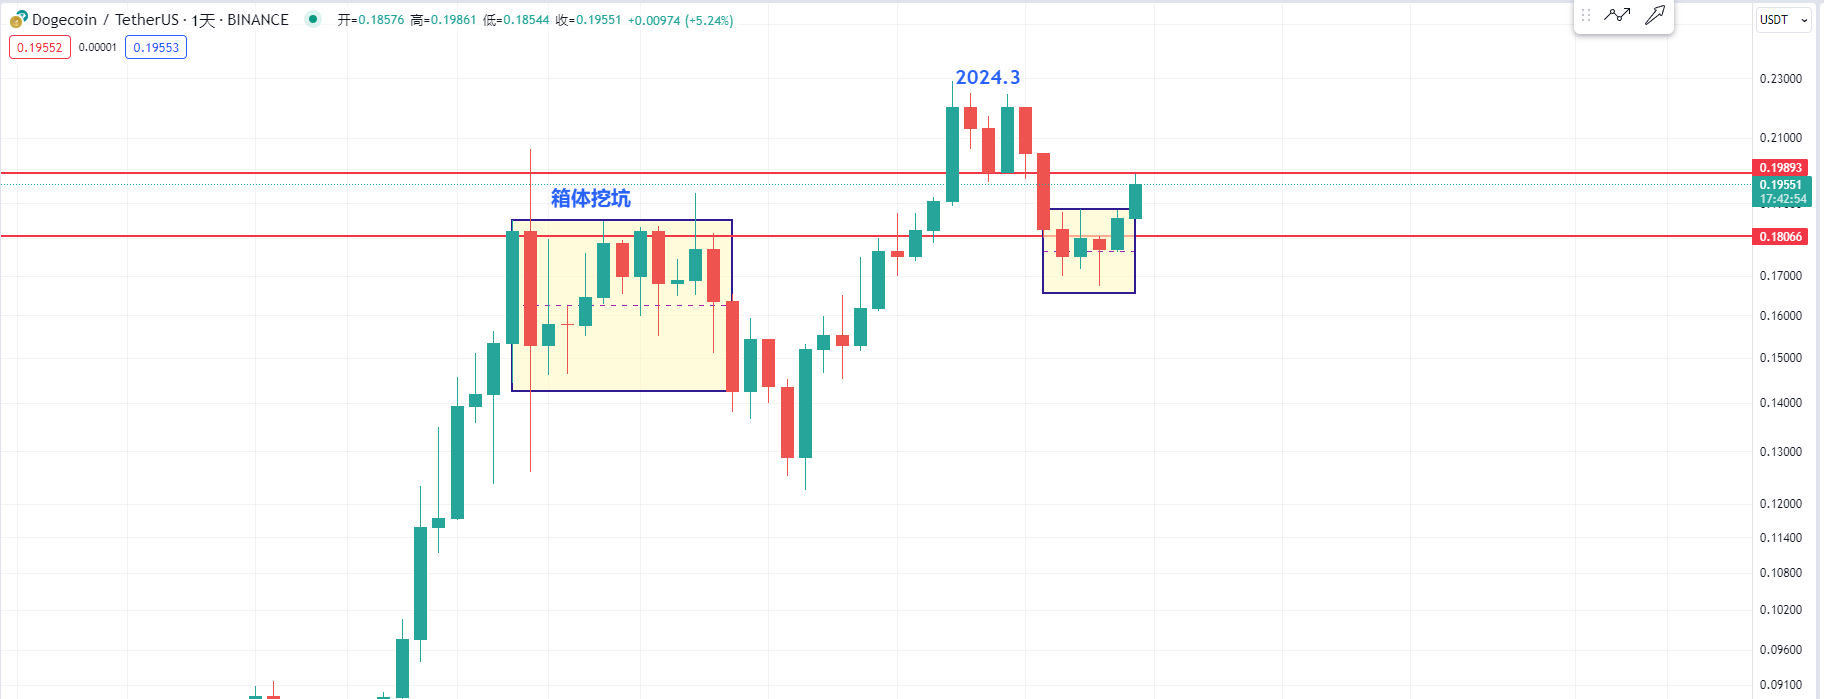
然后我们再来看一下狗狗币的日线级别 前面这边是有一个箱体在挖坑 前几天也是把0.18附近的支撑给跌破了 但是现在还好 狗狗币是有返回到了前面箱体的上方
那么短期在目前的这个位置也是有一个箱体 这边是又回到了箱体的上方 目前还是在强势的盘整区 那么我们就去观察一下短期的压力 就是在3月份这两根K线实体的下方
在短期之内如果突破了这个压力 加上比特币持续上涨 那狗狗币就会有可能像前面的这个箱体之后的走势 箱体跌破然后涨回来 这个位置箱体跌破只要能够涨回去 那么就会突破更高的高点
本文内容由师爷陈(公众号:币神师爷陈)独家策划发布,如需了解更多实时投资策略、解套、现货合约交易手法、操作技巧以及K线等知识可以加到师爷陈学习交流以及免费跟单,希望能帮助到你在币圈找到自己想要的。专注BTC、ETH及山寨币现货合约交易多年,没有100%的方法,只有100%的顺势而为;每日全网更新宏观面分析文章,主流币及山寨币技术指标分析及现货中长线复盘价格预测视频。

温馨提示:本文只有专栏公众号(上图)是师爷陈所写,文章末尾及评论区其他广.告均与笔者本人无关!!请大家谨慎辨别真假,感谢阅读。
免责声明:本文章仅代表作者个人观点,不代表本平台的立场和观点。本文章仅供信息分享,不构成对任何人的任何投资建议。用户与作者之间的任何争议,与本平台无关。如网页中刊载的文章或图片涉及侵权,请提供相关的权利证明和身份证明发送邮件到support@aicoin.com,本平台相关工作人员将会进行核查。


