
Returning from the Qingming Festival holiday, there has been relatively little analysis these days. On April 2nd, a reminder to fill the CME gap at 64000-66500, with the lowest drop to 64493, rebounded for 5 consecutive days, and the price returned to the inside of the box. Ethereum dropped to 3202, with a rebound not as strong as Bitcoin. At the same time, the ETH/BTC exchange rate dropped to near the previous low. Altcoins also dropped a few miles with just a slight pullback in Bitcoin. Many altcoins are near support.
The Dow Jones Index fell back to the platform after forming a "M" pattern on the daily chart. Nasdaq and the S&P 500 have similar situations. After all, the gains during the Spring Festival period were not small, so a pullback is normal.
The US Dollar Index is relatively indecisive, falling back after breaking the triangle pattern on the daily chart. It was previously warned that the US Dollar Index might have a last-minute frenzy to harvest the last batch of "leeks."
After breaking through to a new high, London Gold rose by more than 8%. Gold prices in the market also rose sharply. In times of chaos, gold and jade thrive, and Bitcoin is also benefiting. In addition, with ETF funds pouring in and only purchasing BTC, these people are not here for short-term speculation. If the Bitcoin ETF follows the path of the gold ETF and experiences a slow bull market for ten years, reaching 200,000, 300,000, or even 500,000 is not a dream, but the short-term fluctuations are significant.
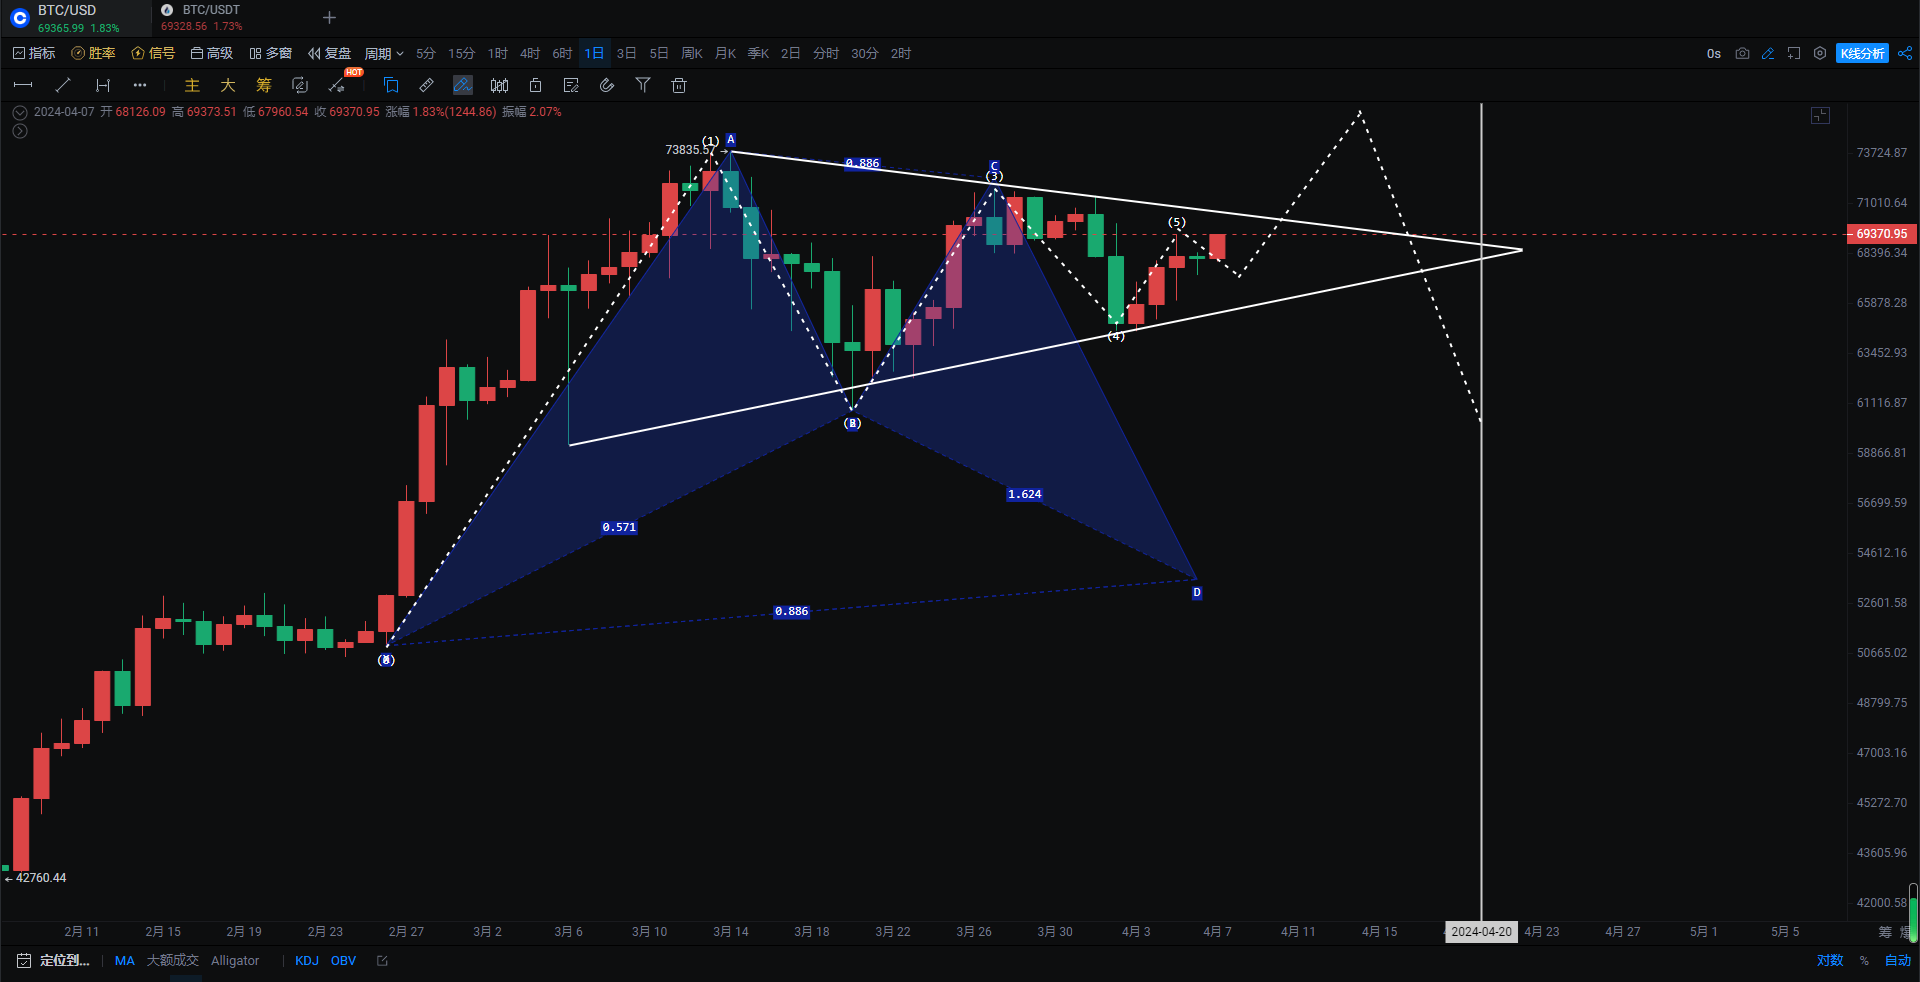
Bitcoin: On the daily chart, it has formed a converging triangle and is waiting to choose a direction for more specific operations. The price line has returned to the BOLL and is moving flat. Whether it halves or not, it is not ruled out that it will continue to oscillate within this BOLL for 13 days. Our strategy is still bullish, but we prefer to look for long positions during pullbacks. Every major pullback is an opportunity.
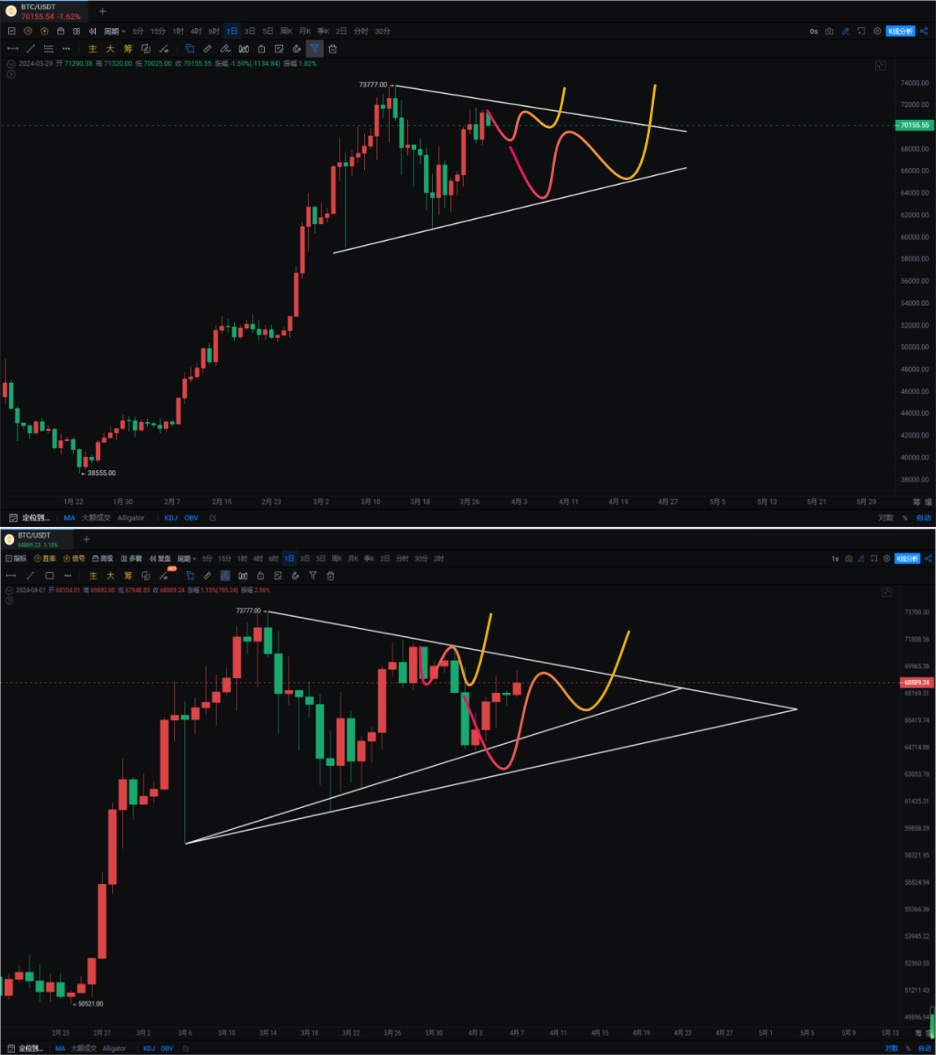
MACD has shown a bullish divergence. As long as this pattern does not change, there is hope to break through to a new high of 75000-76000 and then halve back. Whether this can be triggered still depends on the actual market situation. OBV has been fluctuating around the yellow line. KDJ has formed a double bottom golden cross. On the 4-hour chart, it has returned to the 68300-71769 box. It is currently being suppressed at the 69700 level. If it can effectively break through, there is a chance to break out of the box. Support: 66480-68300 Resistance: 717569-73777
Ethereum: Ethereum has shown a very weak weekly decline with two consecutive bearish candles sandwiching a bullish one. Although there is some support at the pin bar, the weekly RSI, OBV, and KDJ have all turned downwards. If it cannot be brought up strongly by Bitcoin, the risk is relatively high.
On the daily chart, it has not recovered the bearish candle from April 2nd after rebounding for 5 days. The 3678 level serves as the dividing line for the bulls. I will only add to my Ethereum position when it breaks through this price. MACD has also shown a divergence, and OBV has been showing significant outflows below the yellow line, following the decline but not the rise. For the time being, it is best not to pay too much attention to it. Support: 3056-3202 Resistance: 3444-3678
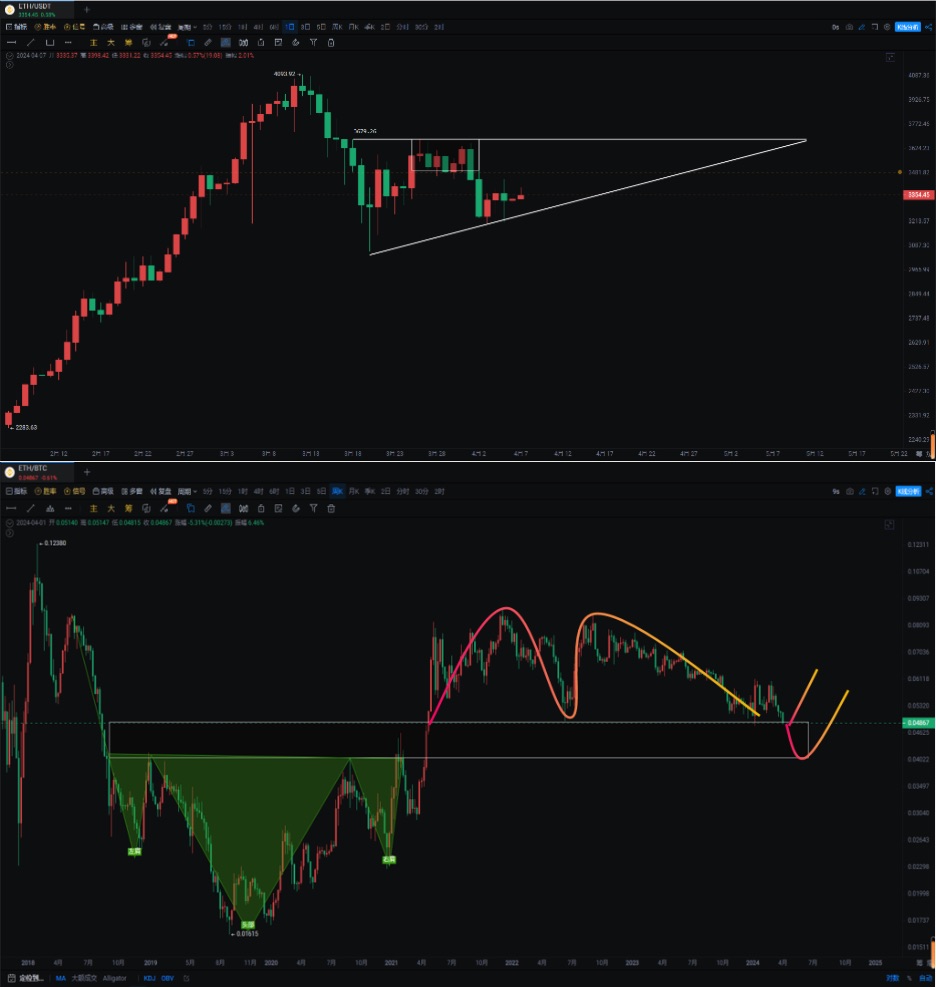
The ETH/BTC exchange rate has dropped to a low of 0.048, with the previous low of 0.0479 just a hair's breadth away. This is also the reason for the recent weakness of Ethereum and other altcoins. Once it breaks through the weekly line, it will open up a downward space, and altcoins will continue to plummet.
If you like my views, please like, comment, and share. Let's navigate the bull and bear markets together!!!
The article is time-sensitive and is for reference only, with real-time updates.
Focusing on candlestick technical analysis, for a win-win global investment opportunity, follow the public account: "Trading Master Fusu"

免责声明:本文章仅代表作者个人观点,不代表本平台的立场和观点。本文章仅供信息分享,不构成对任何人的任何投资建议。用户与作者之间的任何争议,与本平台无关。如网页中刊载的文章或图片涉及侵权,请提供相关的权利证明和身份证明发送邮件到support@aicoin.com,本平台相关工作人员将会进行核查。


