Click to watch the video: https://www.bilibili.com/video/BV1K1421S7hu/?vd_source=04332ad6ecefd22ffa3d1b9032b40fb3
So, I believe that many friends have been a little dizzy about the recent Bitcoin market in the past few days. Later, we will further analyze the topic of whether Bitcoin is still in a bull market, as mentioned in yesterday's video.
However, we still need to be cautious about the recent short-term market. We need to guard against a Bitcoin decline. Later, we will also discuss why, including why I think the current trend of Bitcoin is very similar to the peak of 69,000 in 2021.
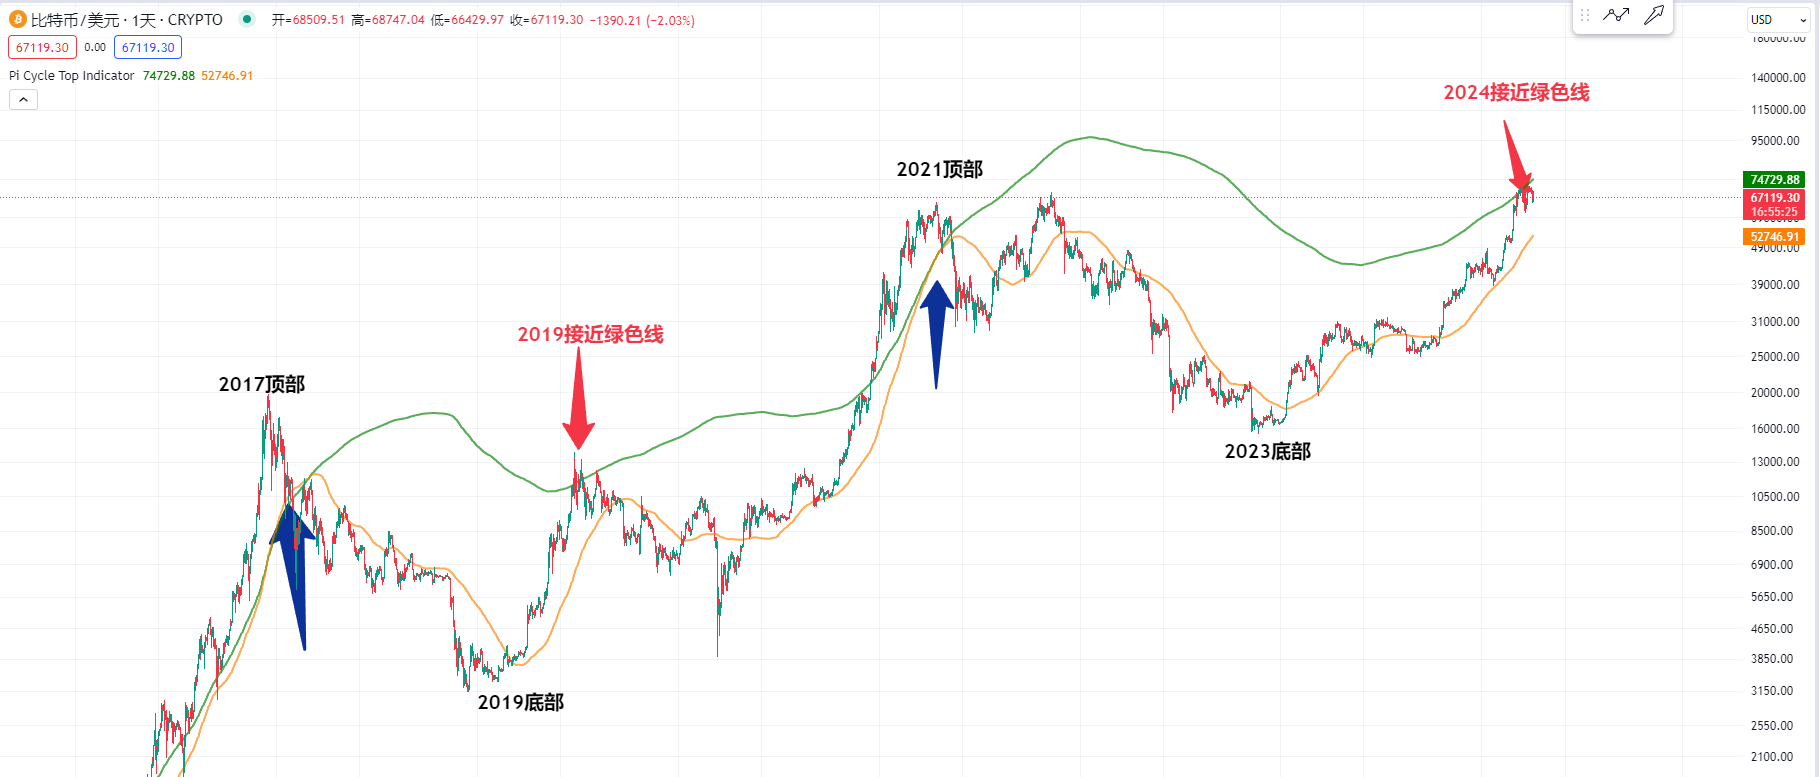
Let's first take a look at the Bitcoin daily chart. The legendary Pi Cycle Top indicator is still there. I still hold the view that the bull market is still ongoing, and we have not reached the peak yet.
Because from the bottom of Bitcoin in 2019 to the high point in 2021, the orange line crossed the green line. The high point around 65,000 is the peak of Bitcoin, or from the bottom of Bitcoin in 2015 to the high point in 2017, the orange line crossing the green line might be the peak of Bitcoin.
So, why do I keep saying that this is not the peak of Bitcoin? The current orange line has not crossed the green line yet. But recently, the price of Bitcoin is very close to this green line. I have also mentioned to everyone that we need to be very careful.
Because we can see that in 2019, when Bitcoin's bottom rose to the position of this green line, it was a good long position at the bottom. But being close to the high point is not the final peak. Bitcoin reached the peak in 2021.
However, we can observe that on the medium and short term, we need to be cautious whenever Bitcoin approaches the green line. We can see that in 2017, when the price approached the green line, it would decline, and approaching the orange line might be a buying point.
So, we need to observe the current position of Bitcoin. If Bitcoin approaches the green line, it will rise, but we also need to be careful. So, if Bitcoin returns to the vicinity of the orange line later, we will see if there will be a buying point for the next step of going long.
Although I made long positions in the medium and long term at the bottom last year, I also want to make medium and long term long positions in Bitcoin again with some new fans.
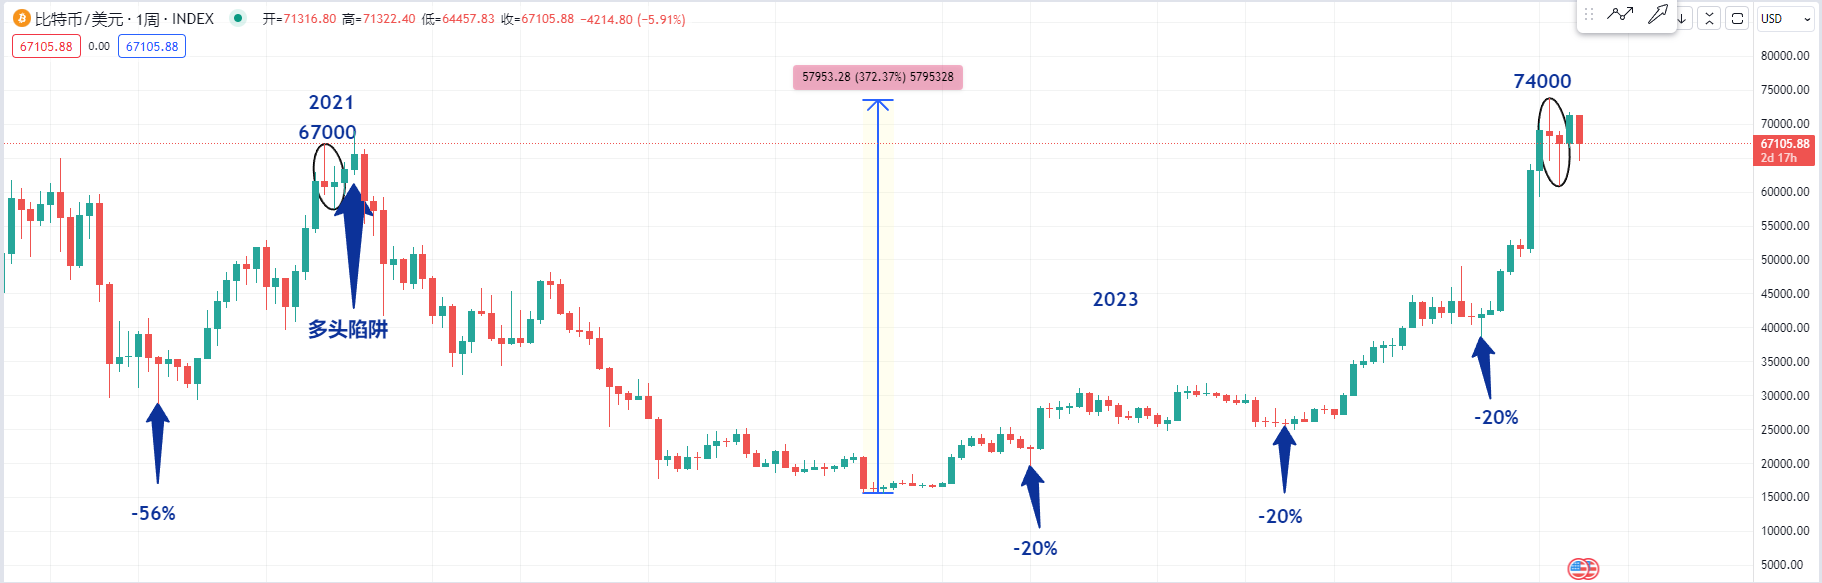
Then let's take a look at the Bitcoin weekly chart. Bitcoin rose from the bottom of 15,000 to 16,000 in early 2023 to the current high point of 74,000, which is a 3 to 4 times increase. We can see that the two long shadow candlesticks near 74,000 are very similar to the candlestick combination at the high point of 67,000 in 2021.
So, why do I say we need to be careful recently? Because the long and short divergence at this position is very significant. Otherwise, there wouldn't be such long upper and lower shadow candlesticks. Later, we can observe that near the high point in 2021, Bitcoin set a bull trap and then a bearish engulfing pattern appeared in the weekly chart.
These two candlestick combinations, or the subsequent candlestick trends, are very similar to the current trend at this position. So, we need to be careful that Bitcoin may have a deep retracement, such as a 30% decline. Of course, my view is that if there is a decline at the current position, it will not be like the bear market decline in 2022.
Or we can observe that from the bottom of 15,000 to the high point of 74,000, Bitcoin has had several retracement low points within the entire bull market, all of which are close to 20%.
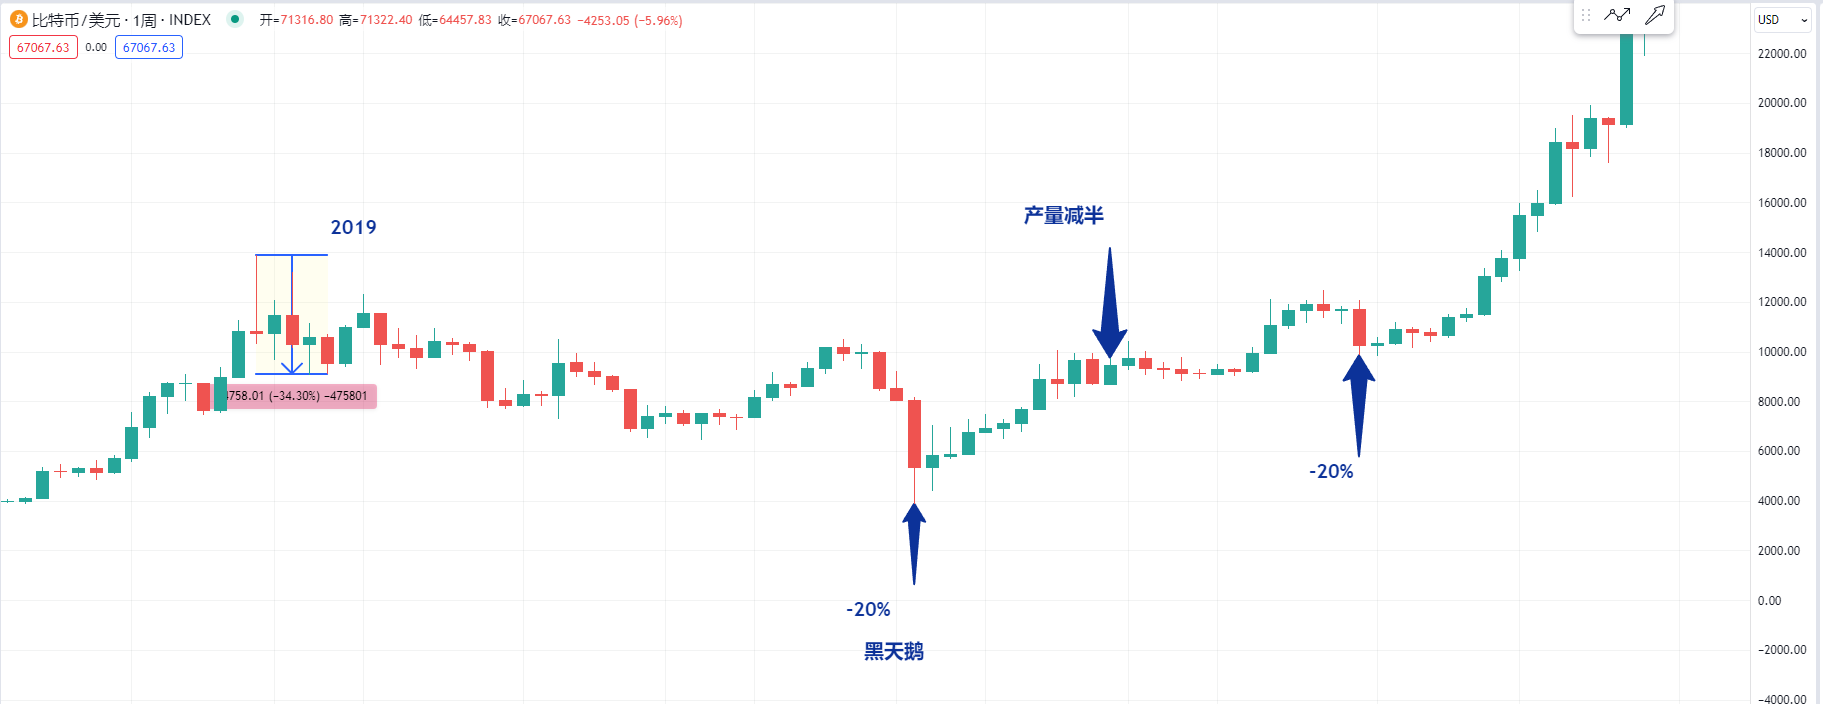
We can see that in the bull market of 2019, if there were no black swan events of the epidemic at the high point, the increase was 3 times, and we need to be careful at the position from the high point to the low point, which was close to 40%.
Or we can observe that around May to June 2020, Bitcoin halved its production. There was a black swan event around this time. We need to be careful that Bitcoin does not have such a decline.

Or we can see that in the bull market of 2016, in July 2016, Bitcoin halved its production at this position. Then we can observe the fluctuation in space before and after.
The position from the high point to the low point dropped by 40%, and even after that, Bitcoin continued to soar. This wave of bull market increased by 100 times, and we can see that there were retracement positions, with declines of 30% to 40%.
So, we can observe that the maximum retracement of this wave currently is only 20%. Since the space has increased so much, we need to be careful about Bitcoin's retracement.
This article is exclusively planned and published by Master Chen (WeChat public account: Coin God Master Chen). If you need to learn more about real-time investment strategies, untangling, spot contract trading techniques, operational skills, and candlestick knowledge, you can add Master Chen for learning and communication, as well as free follow-up. I hope it can help you find what you want in the currency circle. Focusing on BTC, ETH, and altcoin spot contract trading for many years, there is no 100% method, only 100% follow the trend; daily updates on macro analysis articles across the network, technical indicator analysis of mainstream coins and altcoins, and spot medium and long-term replay price prediction videos.

Friendly reminder: Only the column public account (as shown in the picture above) is written by Master Chen. The end of the article and other advertisements in the comment area are not related to the author. Please be cautious in distinguishing between true and false. Thank you for reading.
免责声明:本文章仅代表作者个人观点,不代表本平台的立场和观点。本文章仅供信息分享,不构成对任何人的任何投资建议。用户与作者之间的任何争议,与本平台无关。如网页中刊载的文章或图片涉及侵权,请提供相关的权利证明和身份证明发送邮件到support@aicoin.com,本平台相关工作人员将会进行核查。


