Click to watch the video: https://www.bilibili.com/video/BV1UM4m1X77q/?vd_source=04332ad6ecefd22ffa3d1b9032b40fb3
So in today's video, let's talk about where Bitcoin is likely to drop in the near future. In last week's video, I mentioned that Bitcoin has two harmonic patterns that we need to be cautious about. So, for those who have taken mid-term short positions in these few days, let's also consider whether to close the positions.
Or if you have mid-term short positions, how should you set your take-profit and stop-loss levels? Of course, my view on yesterday's major drop remains unchanged. The bull market for Bitcoin has not ended. So, I believe that this recent drop also presents an opportunity. We'll see if we can find a new low for another opportunity to go long in the mid to long term, thereby helping everyone achieve financial freedom.
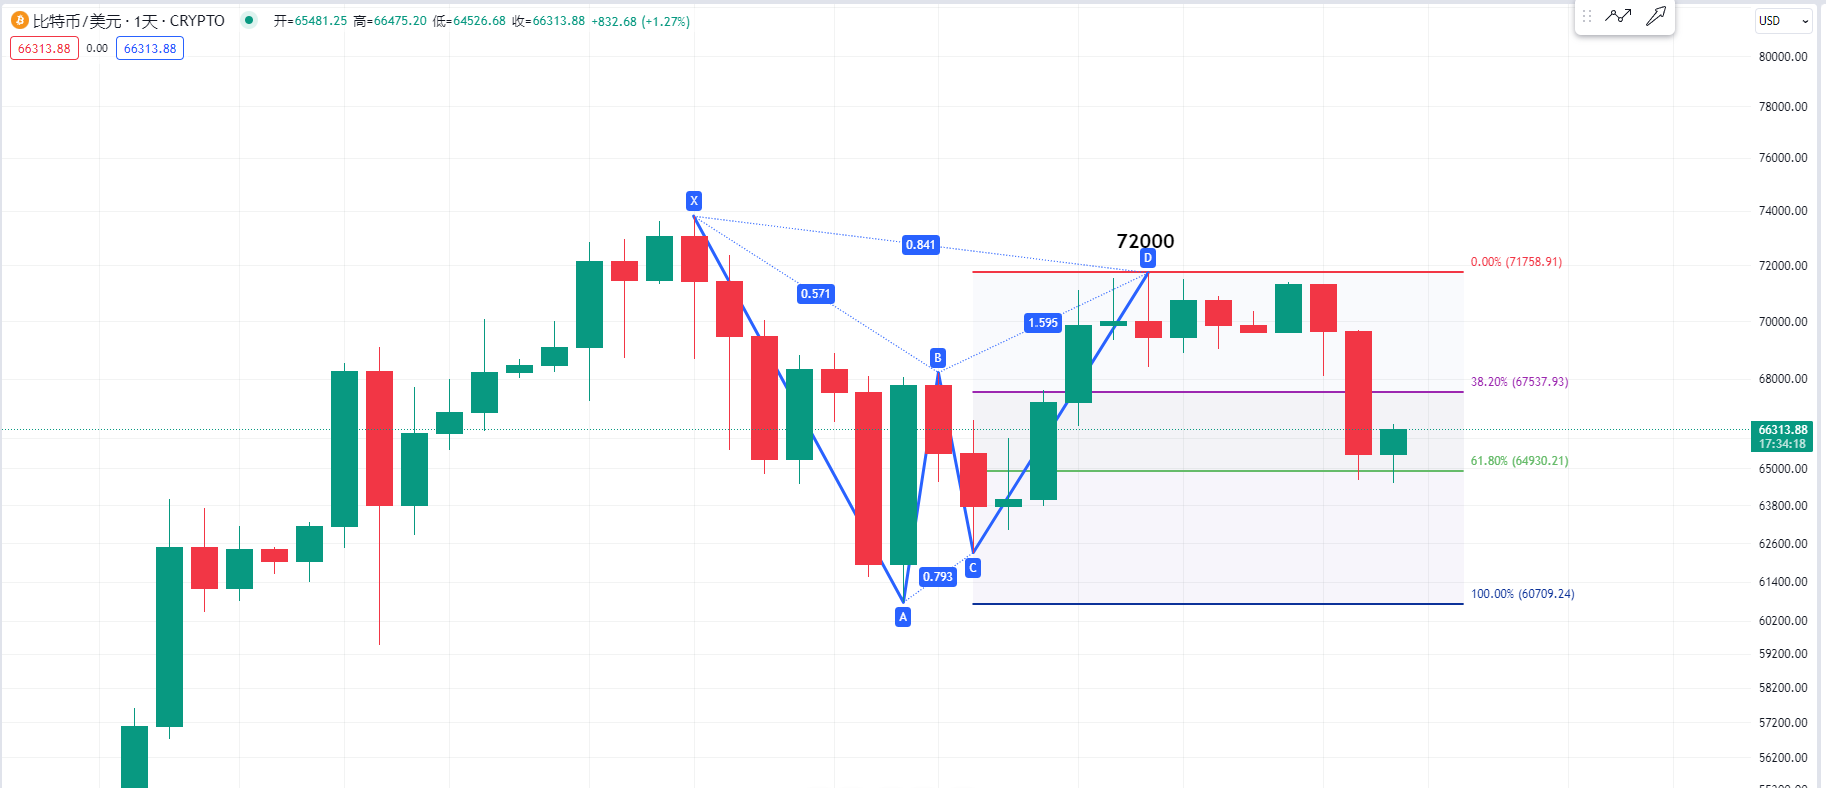
First, let's take a look at the Bitcoin daily chart. Last week, I also mentioned in the video that Bitcoin seems to have a bearish Gartley pattern at this level, or it could potentially turn into a bearish bat pattern. I've been reminding for some time that if we want to resolve this bearish pattern, Bitcoin needs to quickly break through the 72,000 level.
However, it ended up trading sideways at this level for 5 to 6 days without breaking through the 72,000 level. Now the price has dropped, or for those who have taken short positions near 72,000, my view is that you can adjust your take-profit level to the support level of 68,500 to 69,000. But now that this support level has been breached, I believe you can set your stop-loss at 69,000 and see if Bitcoin will have even lower lows.
Of course, yesterday's sharp drop in the short term is quite significant. So, it's also okay to partially close your short positions to take profits. Because the low point of yesterday's drop was close to the 0.618 Fibonacci retracement level.
So, it's okay to take some profits from your short positions, and you can set your stop-loss at 69,000 and see if there will be even lower lows.

Now let's take a look at the Bitcoin daily chart again. Is it possible for Bitcoin to have even lower lows? Last week, I also mentioned in the video that it's best for Bitcoin to have a bullish Gartley pattern at this level.
But if it's a bearish bat pattern, then we need to be cautious about the possibility of lower prices at point D. However, we can review a few relatively accurate judgments of Bitcoin's daily chart in history.
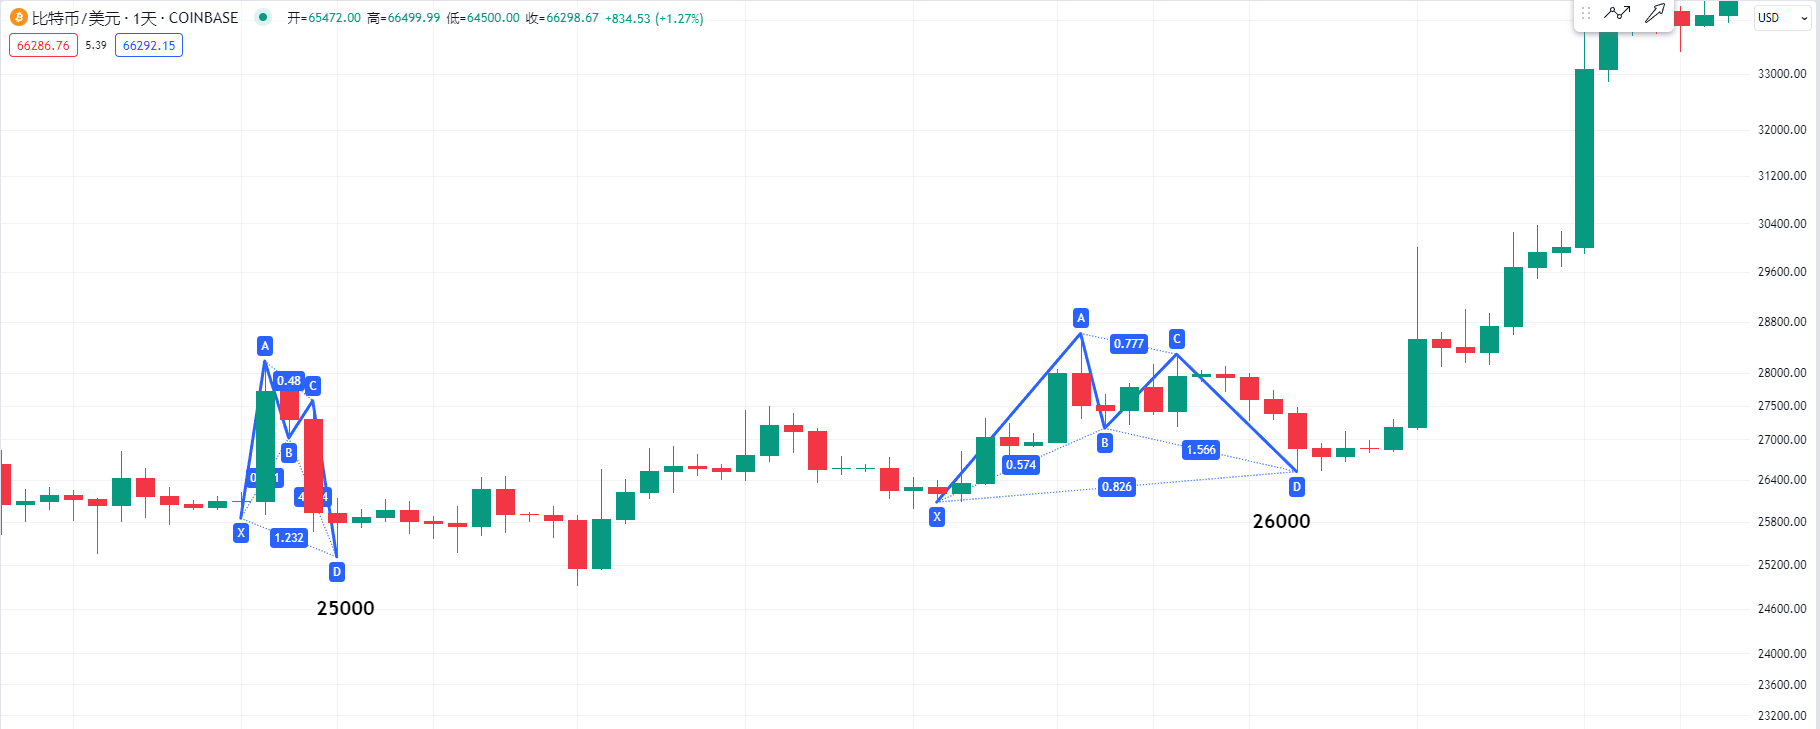
We can observe that in October 2023, why did I tell everyone to go long or buy the dip at the 26,000 level? Even the low point of Bitcoin at 25,000 also had a harmonic pattern. For short-term contract trading, it's the same. If we're wrong, we need to stop the loss. We can stop the loss several times, but if we're right, we need to take the profits in the mid-term.
Then let's take a look at whether the current position of Bitcoin is a bullish Gartley pattern. Let's first look at the retracement of point B from the position of point X to the position of point A. The Gartley pattern is at 0.618.
If it's a bat pattern, it will be around 0.5, or if it's a butterfly pattern, it will be at 0.786. And the crab pattern is also around 0.618. Sometimes I set the position of point B relatively loosely. Will it really be a bullish Gartley? I also hope it's not another pattern.
Because for other patterns, or the position of point C, most harmonic patterns are basically at 0.886. It's just that point D is a bit different. So let's take a look at the position of point D. I hope it's a bullish Gartley, and the 0.786 position is near 55,000. Will there be support at this level? And if the position of point D is a bullish bat, we can observe that the 0.886 position is a bit deep, approximately near the high point of the previous consolidation area. And if this pattern is not a Gartley or a bat, in case it's a butterfly pattern, we can observe that the 1.272 position will be near 44,000. We can observe whether there will be support at this level. If it's not a Gartley pattern or a bat pattern, we won't continue to deduce, because if we continue, I might get scolded again.
So let's first observe where Bitcoin will drop to. It's currently quite difficult to predict. The higher the price space rises, the low points of retracement can only be tracked step by step. If there are low points, then we'll see if there's an opportunity to go long together.
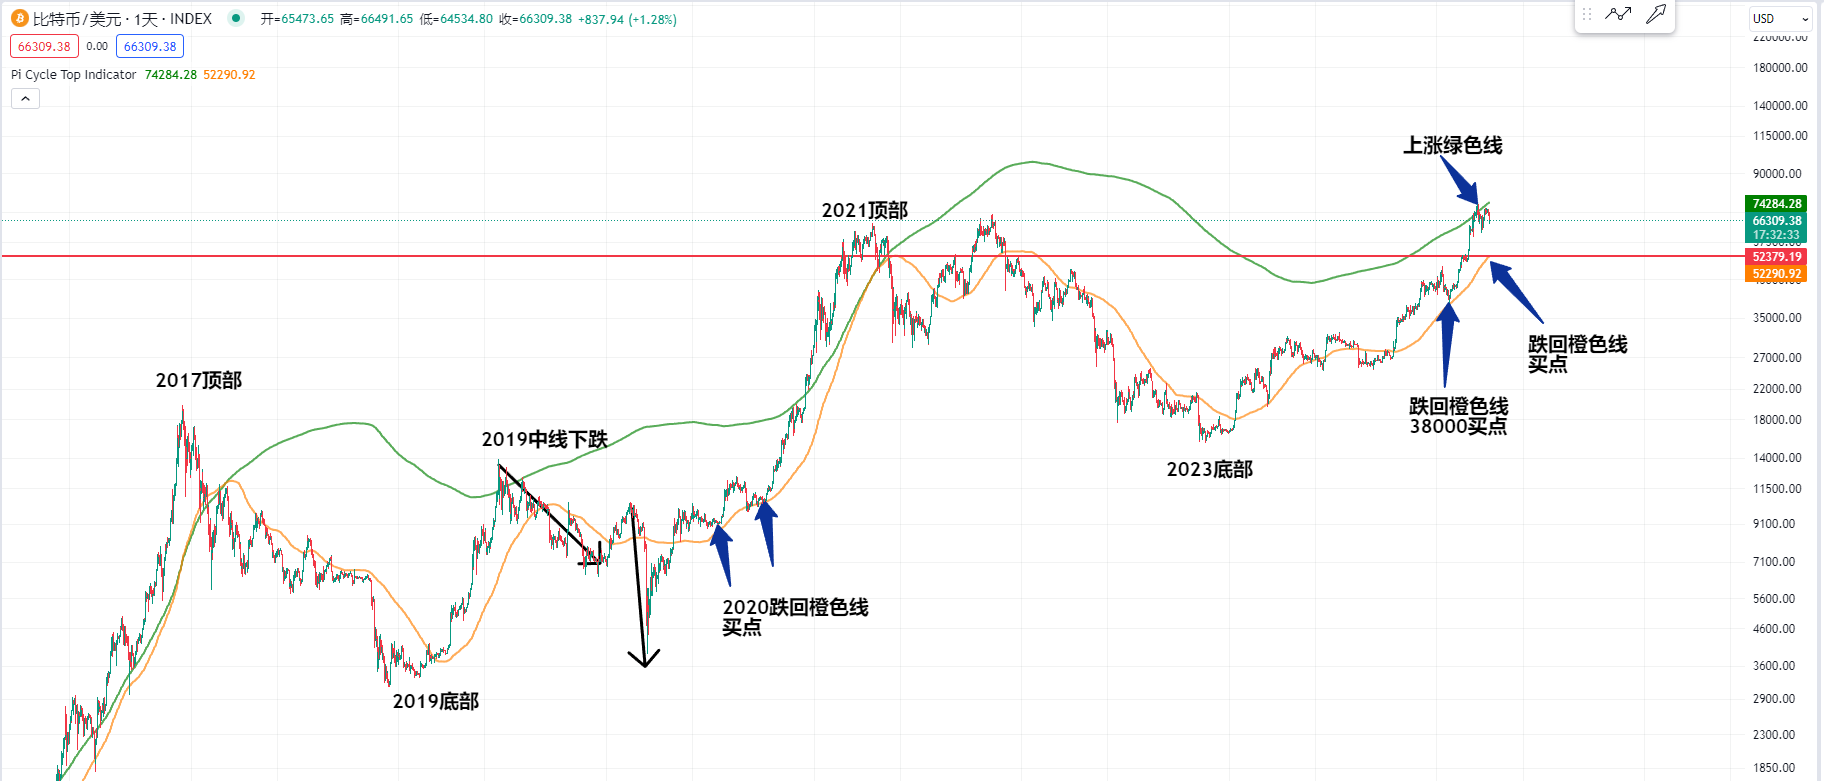
Now let's take a look at the PI cycle top indicator on the Bitcoin daily chart. Why do I say the bull market has not ended? Don't forget about this PI cycle top indicator.
I mentioned some time ago that historically, Bitcoin's bull market rises to the orange line of the PI cycle indicator crossing the green line. At this position in 2021, Bitcoin rose to above 60,000 and then peaked. Or we can observe that in 2017, Bitcoin also reached the top at this position, with the PI cycle top indicator's orange line rising to a high point and then crossing the green line. The crossing point is likely the top.
So for now, I still believe that Bitcoin's bull market has not ended. It's just that it has risen too much in the short term. I mentioned some time ago to pay attention to the historical prices of Bitcoin. If it rises to the green line, we need to be a bit cautious. Because we can see that in 2019, when Bitcoin rose to the green line, there was a short-term or mid-term decline. Now that it has risen to the position of the green line, it's currently falling. So we need to pay attention to whether it might fall back to near the orange line, which will be our next buying point.
Because we can see that the last time was near 38,000, it was also close to this orange line, which is a very important buying point. Including in 2020, it fell back to near the orange line, which was also a very good buying point. So the upper area near the green line is a selling point, and the current price of the orange line is near 52,000. You can also take the time to observe historical experiences.
This article is exclusively planned and published by Master Chen (WeChat public account: Coin God Master Chen). If you need to learn more about real-time investment strategies, how to resolve positions, spot contract trading techniques, operational skills, and candlestick knowledge, you can add Master Chen for learning and communication, and free copy trading. I hope it can help you find what you want in the cryptocurrency circle. Focusing on BTC, ETH, and altcoin spot contract trading for many years, there is no 100% method, only 100% trend-following; daily updates on macro analysis articles across the web, technical indicator analysis of mainstream coins and altcoins, and spot mid to long-term review price prediction videos.

Friendly reminder: Only the column public account (as shown in the picture above) is written by Master Chen. The end of the article and other advertisements in the comments section are not related to the author. Please be cautious in distinguishing between true and false. Thank you for reading.
免责声明:本文章仅代表作者个人观点,不代表本平台的立场和观点。本文章仅供信息分享,不构成对任何人的任何投资建议。用户与作者之间的任何争议,与本平台无关。如网页中刊载的文章或图片涉及侵权,请提供相关的权利证明和身份证明发送邮件到support@aicoin.com,本平台相关工作人员将会进行核查。


