Click to watch the video: Master Chen's 3.28 Video: Will DOGE Face Pressure and Will the Market Go Short at 71000?
Today's video will discuss when to close the long position of holding Dogecoin for profit. Some fans are also worried that Dogecoin will not reach 0.2. Personally, I believe that the long position of Dogecoin can still be held. Although it is still early to reach the target of $1, including later we will also take a look at the short-term trend of Bitcoin.
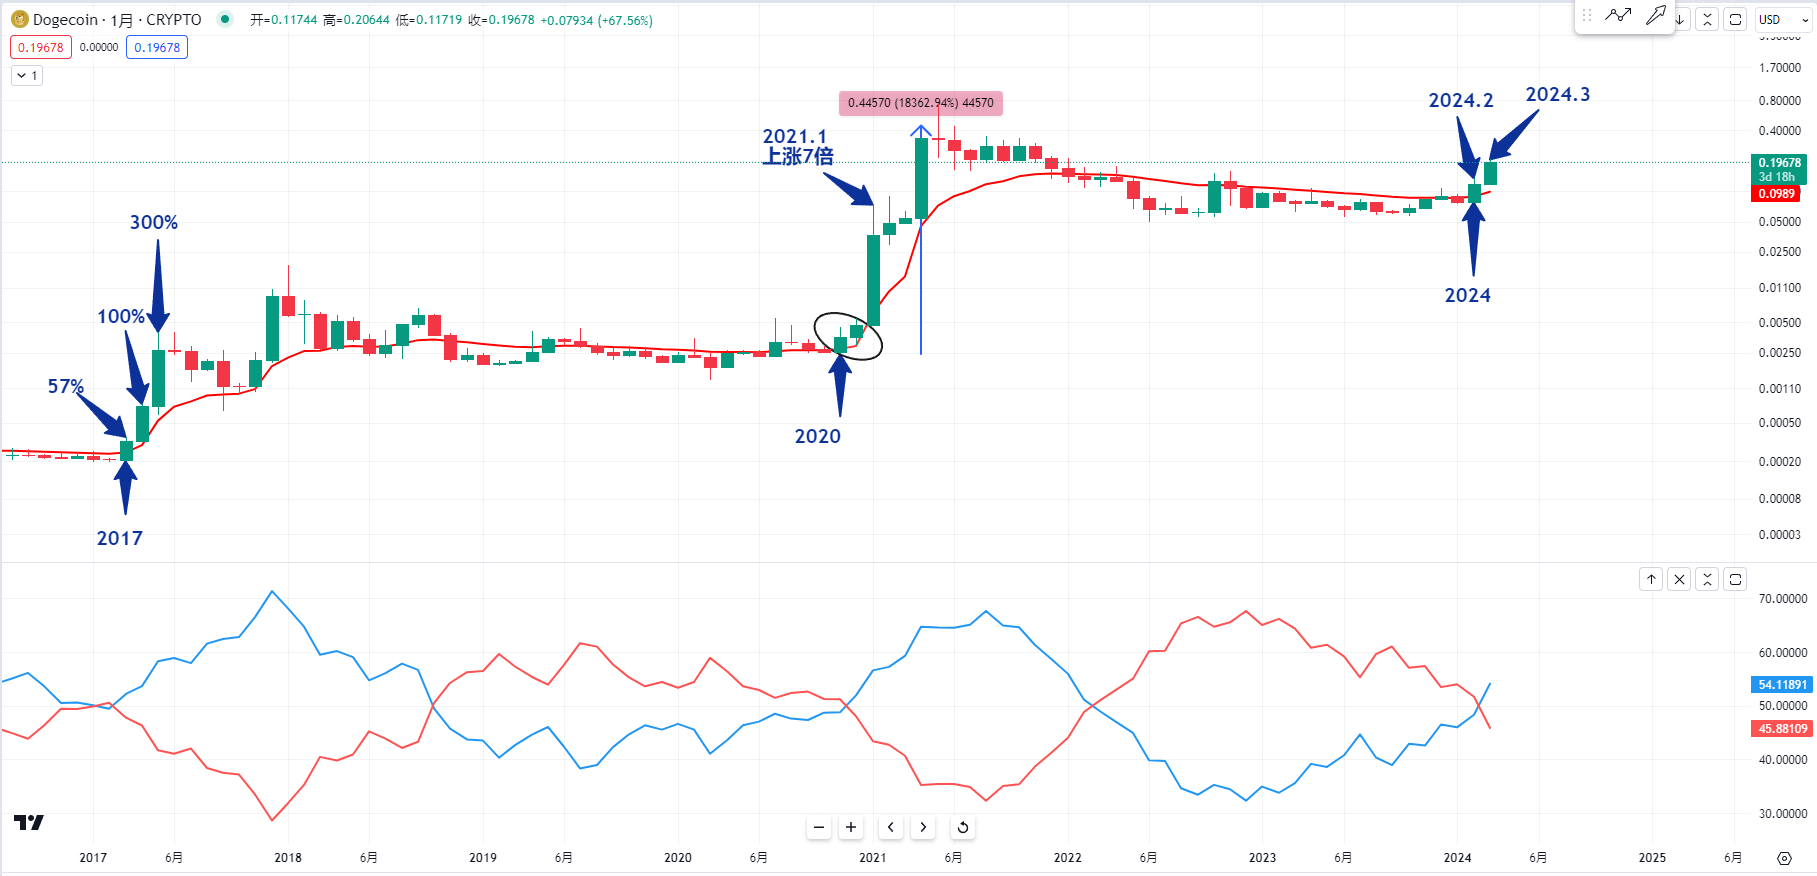
First, let's take a look at the monthly chart of Dogecoin. Some fans have asked me whether Dogecoin will drop again after reaching 0.2, just like the last time. I think if you hold a long position, you should not worry about short-term fluctuations. Long-term growth is where the big profits lie.
We can observe that the ASO sentiment index at the monthly level has already had a golden cross, and it does not happen in the short term. The last golden cross occurred about 1200 days ago, or in 2020, which was about 1300 days after 2017. It means that such an important golden cross only happens about every 4 years. Some are worried that the pressure of 0.2 cannot be overcome. We will also observe this later. If the pressure of 0.2 is broken, then where will the next pressure level be?
We can observe the historical ASO sentiment index of Dogecoin at the monthly level. The uptrend in February and March of this year is very similar to the two uptrends in 2020. We can observe that at that time in 2020, it was just about to break the 20EMA at the monthly level. We can observe whether the current candle has broken the 20EMA and then risen again, which is very similar to the position in 2020, and it has roughly doubled.
So, near the price of 0.2, we can observe that the previous uptrend candle in January 2021 rose nearly 7 times. So, the current two candles are very similar to the two candles at the same position in 2020, and there will definitely be a bigger uptrend later. Is it possible for Dogecoin to rise another 3 to 4 times or roughly 7 times like the candle in January 2021, reaching about $1? Then we can consider whether to close some of the long positions for profit.
We can also observe the position of Dogecoin in 2017. At that time, there was also a golden cross at the monthly level, and the first candle rose by 57% after breaking the 20EMA at the monthly level. Then the second candle rose nearly doubled, and the third candle rose nearly 300%. We can observe that the third candle in 2017 and the third candle in 2020 are very similar. So, I believe there will be a bigger uptrend later. We can consider closing some positions when it rises another 3 to 4 times or reaches about $1, to prevent any subsequent decline.
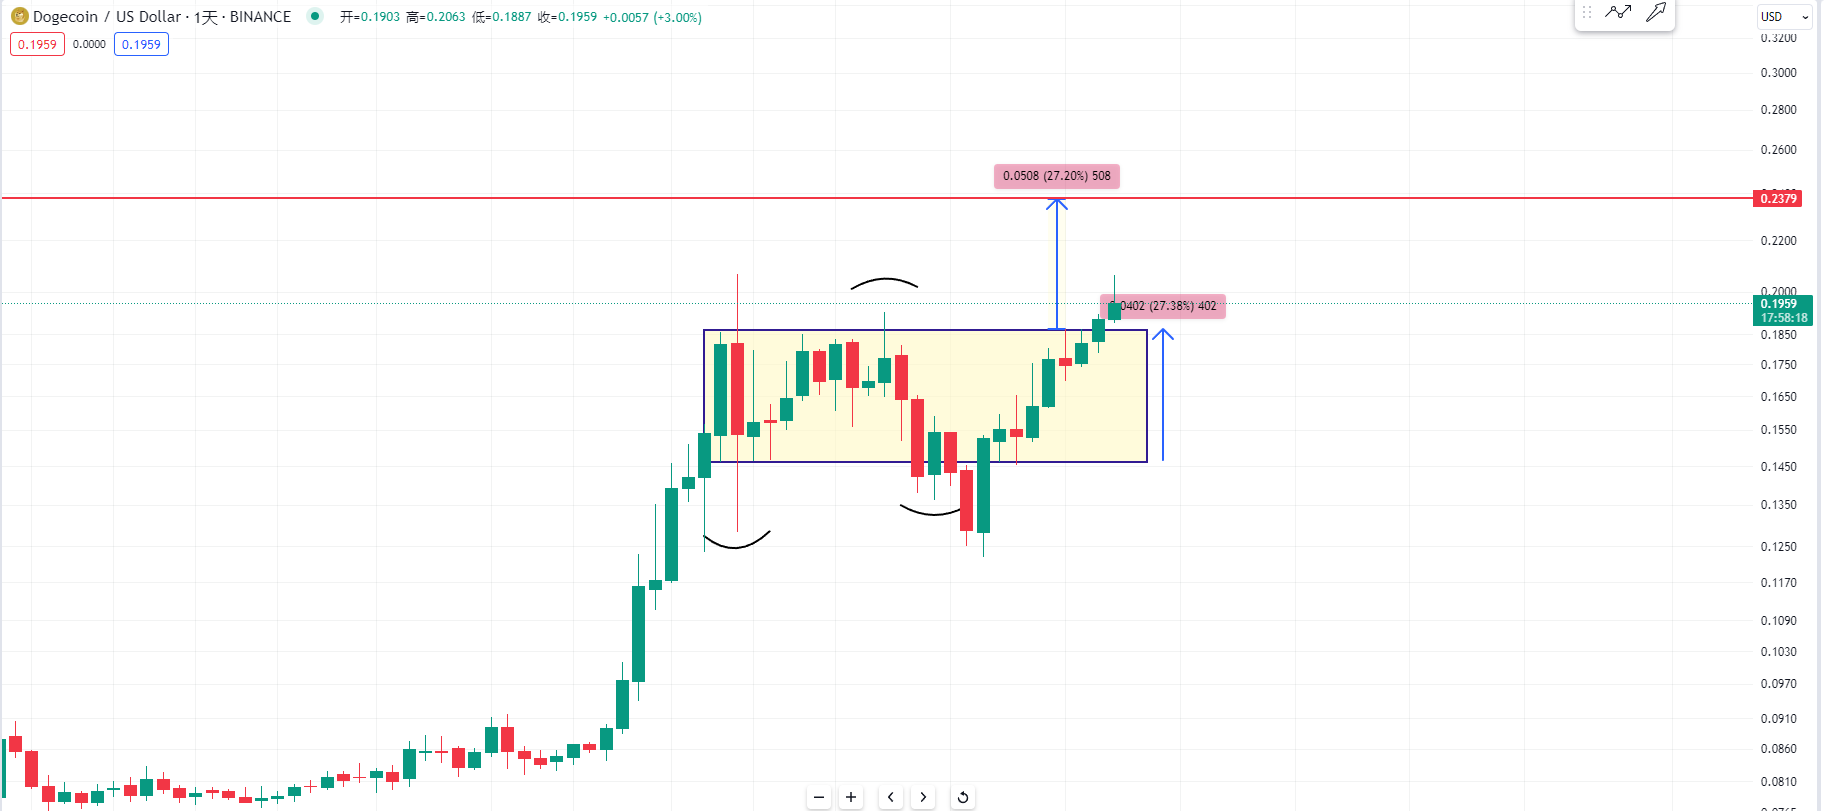
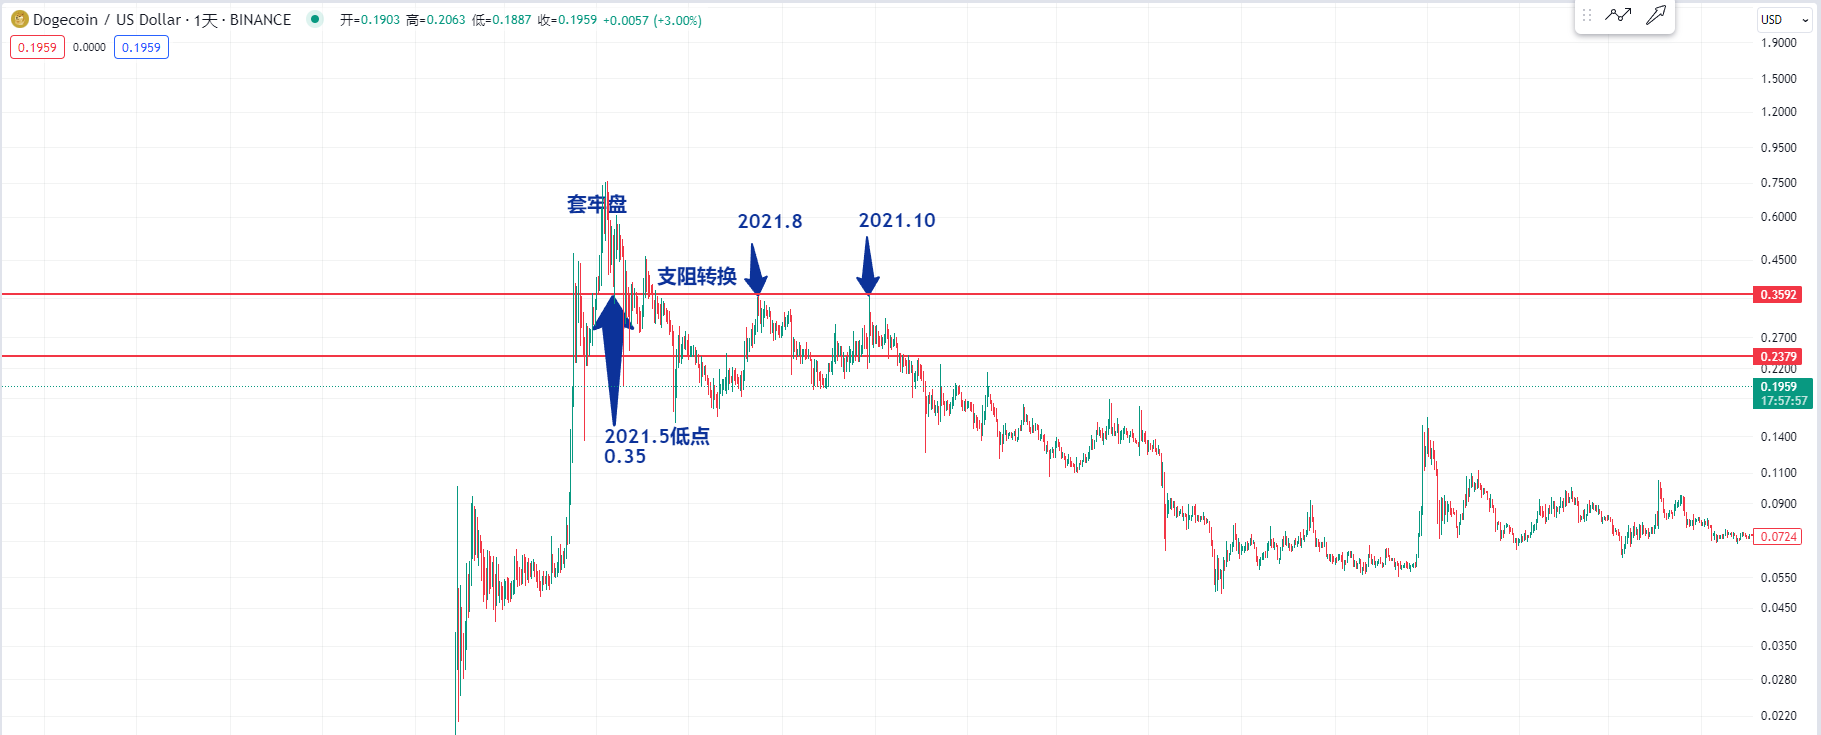
Next, let's take a look at the daily chart of Dogecoin. The current box pattern has been broken. We can measure whether it will continue to rise to the position of 0.22 to 0.23. However, I believe the next pressure level will not be at 0.22. We can observe that in May 2021, there was a low point near 0.35, and in August and October 2021, it did not break the pressure level of 0.35. If 0.2 and 0.22 can be broken, then we should observe whether 0.35 will be the next pressure level for Dogecoin.
Now let's take a look at the daily chart of Bitcoin. In the previous video, I mentioned a bearish bat pattern at the daily level. The D point yesterday rose to nearly 71000. Currently, I have a short position for Bitcoin. This position is confirmed as a bearish bat pattern. Because as I mentioned in the previous video, Bitcoin rarely has a 7-month uptrend at the monthly level, at least in the short or medium term, including these three bullish candles. We should be cautious about a potential retracement. For those who have short positions near 71000, there are a few target levels to consider. The Fibonacci retracement from point A to point D shows that the 0.382 level is near 67000. Since it is a bull market, I believe 0.382 and 0.618 are both target levels. The defensive position can be moved to the cost level where you entered.
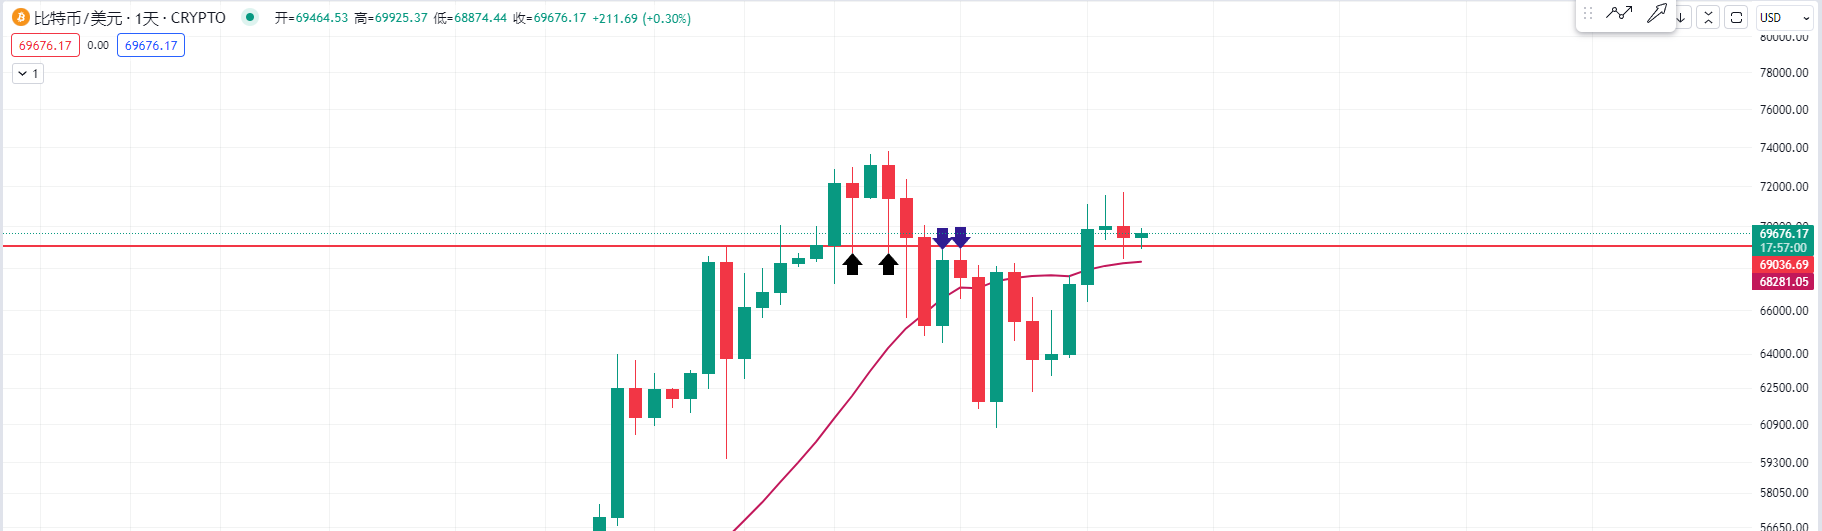
Let's continue to observe the daily chart, because an important support for Bitcoin that I mentioned in the previous video is that it should not fall below 69000 in the short term, as it is the low point of the lower shadows of the two candles in March and the high point of the two candles in March. Yesterday's lower shadow fell below 69000, but the closing price did not fall below 69000. We should observe the current range, and it's best for the Bitcoin price not to fall below the 20MA. If it falls below the 20MA, there will be a significant short-term retracement.
This article is exclusively planned and published by Master Chen (WeChat public account: 币神师爷陈). If you need to learn more about real-time investment strategies, how to get out of a dilemma, spot contract trading techniques, operational skills, and candlestick knowledge, you can add Master Chen for learning and communication. I hope it can help you find what you want in the cryptocurrency circle. Focusing on BTC, ETH, and altcoin spot contracts for many years, there is no 100% method, only 100% trend-following; daily updates on macro analysis articles across the web, technical analysis of mainstream coins and altcoins, and spot mid- to long-term replay price predictions.  Friendly reminder: Only the column public account (shown in the image above) is written by Master Chen. The end of the article and other advertisements in the comments section are not related to the author. Please be cautious in distinguishing between true and false. Thank you for reading.
免责声明:本文章仅代表作者个人观点,不代表本平台的立场和观点。本文章仅供信息分享,不构成对任何人的任何投资建议。用户与作者之间的任何争议,与本平台无关。如网页中刊载的文章或图片涉及侵权,请提供相关的权利证明和身份证明发送邮件到support@aicoin.com,本平台相关工作人员将会进行核查。


