
The monthly chart is about to take shape. Currently, the price has been oscillating around the previous bull market high of 69,000, and we have also mentioned that 68,600 is the dividing line between long and short positions. If 68,600 cannot effectively hold the upward attack, there is a chance to retest the bottom support. There are 23 days left until the halving of Bitcoin on April 21st, and Friday is the largest quarterly option expiration date. Pay attention to market fluctuations.
Last night, Bitcoin experienced a nearly 3400-point needle insertion. I don't know if it's good for friends trading futures. Currently, the liquidity is not at the same level as the beginning of 2023. In a bull market, needle insertions are common. Endure loneliness to preserve youth.
Bitcoin
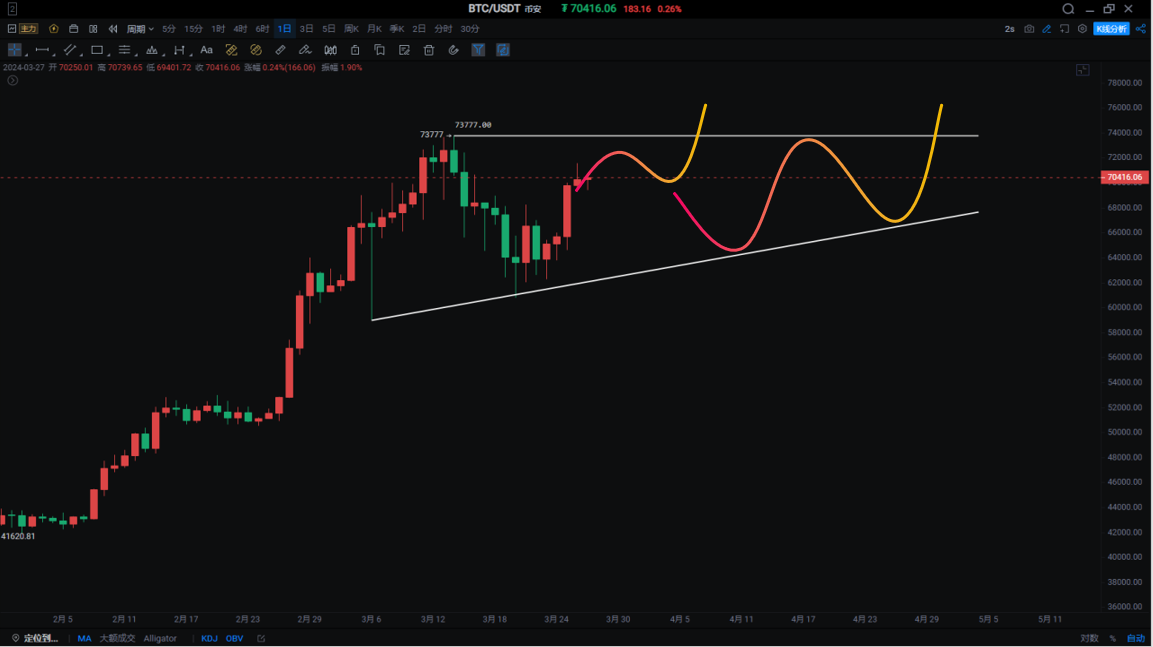
The overall trend of the daily chart of Bitcoin is still a large-scale triangular pattern in my personal opinion. The needle insertion on March 5th at the bottom and the bottom line on March 20th form a triangle, with the top at 73,777. It oscillates within this triangle before the halving. If there is a significant decline during the halving period, 59,000–60,000, or even 52,000–56,000, are all opportunities to buy in batches.
The 4-hour temporary trend is consistent with our prediction yesterday. The nearly 3400-point needle insertion tested the support rebound at 68,359 in the evening. Currently, a bullish descending flag has formed on the 4-hour chart. Pay attention to the rebound strength at the low point last night on the hourly chart. If the support does not hold, it will test around 68,000.
Support:
Resistance: 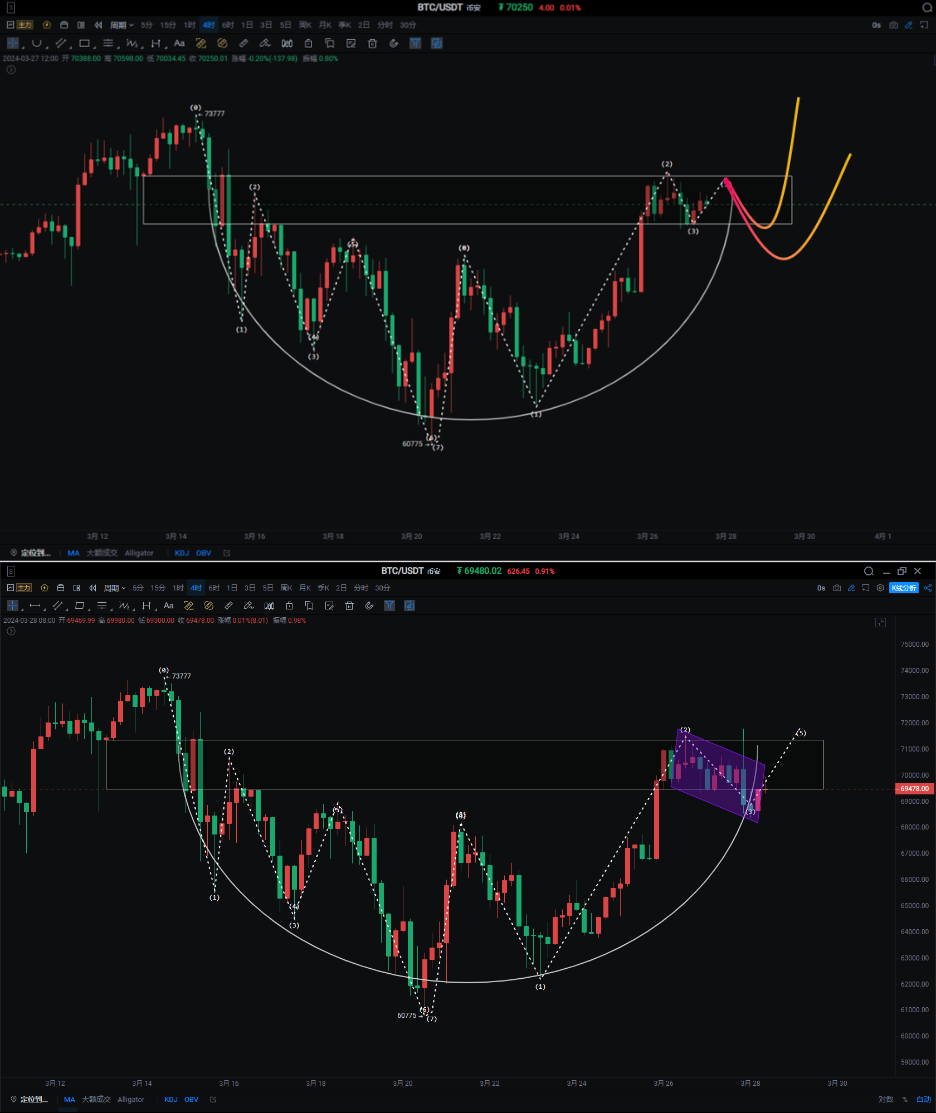
Ethereum
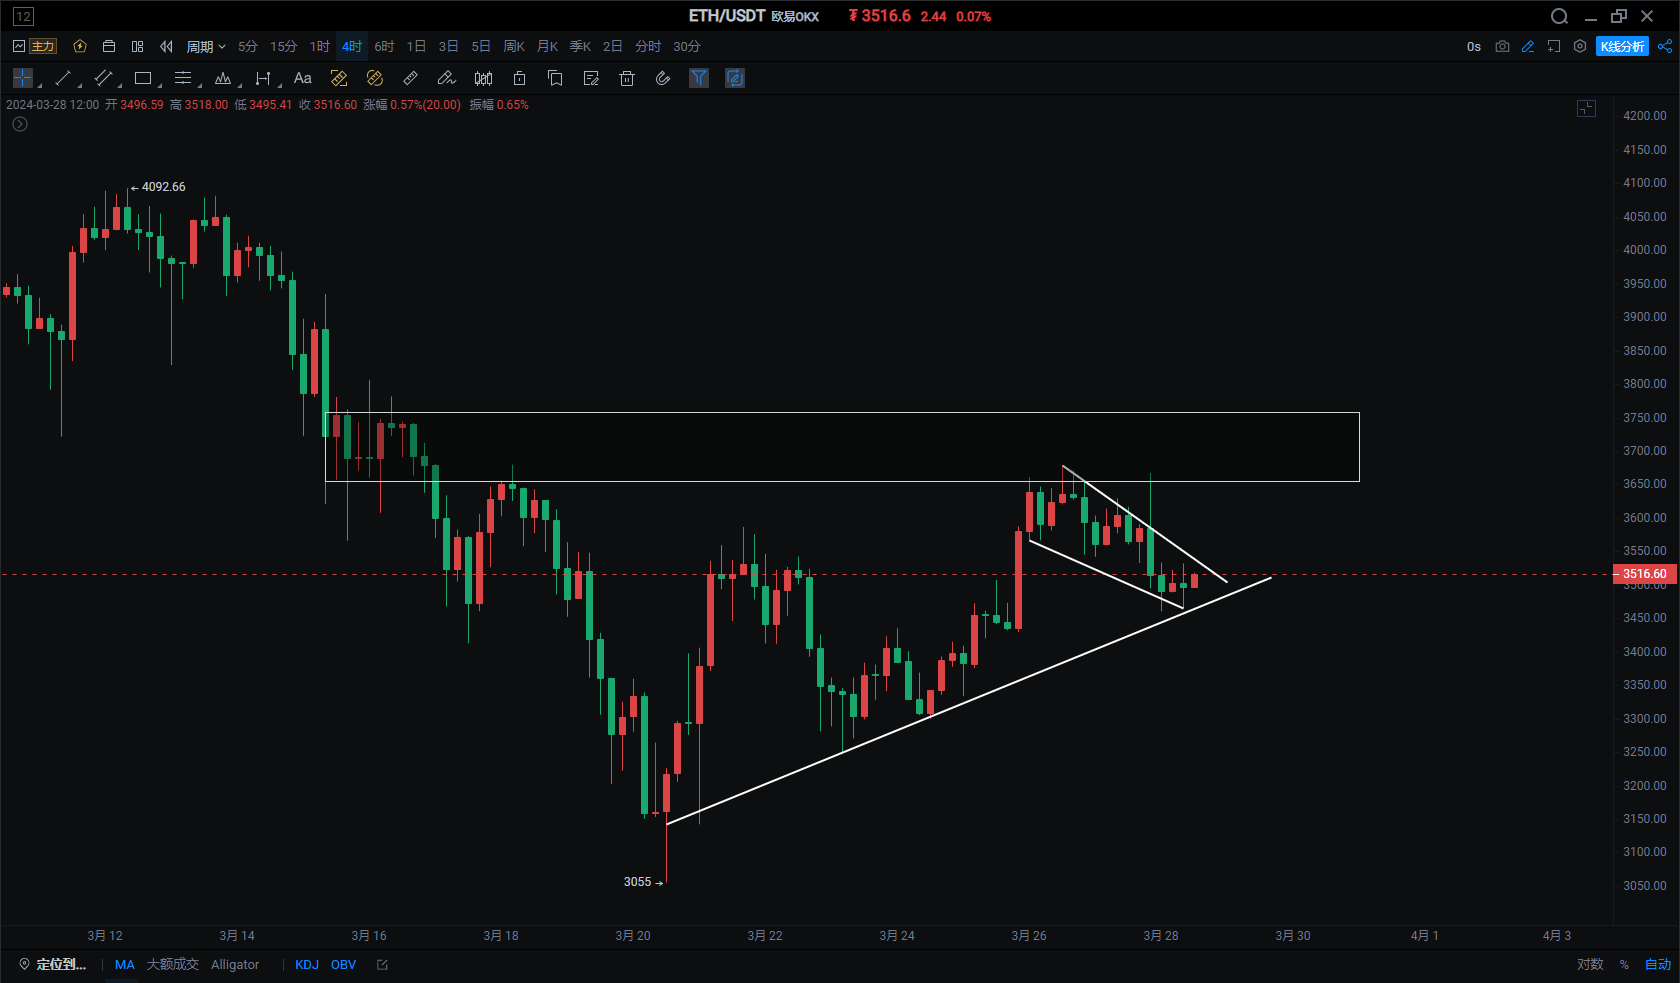
The price line on the daily chart has been trending weakly below the BOLL lower rail, and as mentioned yesterday, the OBV has been in a state of outflow. Be cautious of the MACD histogram lengthening below the waterline, indicating a retest of the bottom.
On the 4-hour chart, a descending wedge has formed, and it may need time to grind due to the impact of last night's needle insertion. Pay attention to the breakthrough of the descending wedge.
Support:
Resistance:
The ETH/BTC exchange rate continues to fall out of the box and is heading towards the 0.0479 support. It could rebound at any time. Pay attention to the rebound opportunities for Ethereum and whether it can lead to an altcoin rebound.
If you like my views, please like, comment, and share. Let's go through the bull and bear markets together!!!
The article is time-sensitive and is for reference only, with real-time updates.
Focus on candlestick technical research, win-win global investment opportunities. WeChat public account: 交易公子扶苏
免责声明:本文章仅代表作者个人观点,不代表本平台的立场和观点。本文章仅供信息分享,不构成对任何人的任何投资建议。用户与作者之间的任何争议,与本平台无关。如网页中刊载的文章或图片涉及侵权,请提供相关的权利证明和身份证明发送邮件到support@aicoin.com,本平台相关工作人员将会进行核查。


