昨日比特币迎来下跌,连续多次在破高的情况下冲高回落,无疑打击多头积极性,日线本周完成局势的扭转后昨日未能实现延续,币价一度突破71000关口但短线随即大幅回落,71000也成了多头短期难以逾越的槛;连续的受阻需要我们提起警惕,重新审视短线可能会出现的走势变化;原本日线在企稳70000关口,按照趋势运行节奏有望直接冲击73000大关,但日线昨日报收上影阴线,70000关键阻力位也未能站稳,日线高位连续出现调整的十字K线形态,短线上不能再无脑的做多看涨。
当然短期趋势上现在无法有效判断是多还是空,昨日回调没有改变本周以来的日线上涨趋势,因为68000没破,如果日线有效跌破此位置的话,我们再去看日线短期上的回调延续,并且,近两日虽然冲高回落,但同样没有转换为强势大阴下跌,还是偏向调整;短线,以71200作为压制点小时线展开震荡下行,但是币价目前也没有跌破上行趋势线;下方,关注两个位置,凌晨回撤支撑68500,以及日线重点支撑68000,68000的得失将至关重要。
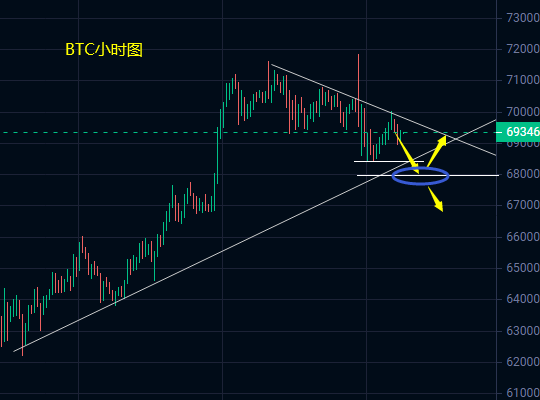
短线769800-70000空,下方68000多
以太坊,上涨意愿不强,下跌倒是抢在第一步;昨日继续冲高3670承压大幅回落,其中小时线上看,币价已经连续三次反弹触及此位置后下跌,且昨日的下跌中更是直接跌破3550日线关键支撑位,此位置的失守对于原本无意上涨的以太坊来说备受打击;小时线的上行趋势线已经跌破,同时构筑下行通道,如果是延续回撤,以太坊的下跌力度肯定会加强;日线形成黄昏之星,日内下方关注3400一线支撑,守住的话多头还有机会;日内短线,继续看下跌,做空为主。
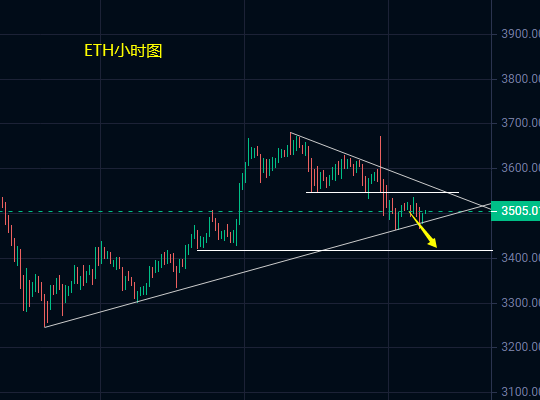
短线3530-3550空,下方3400多
本文由本人小冯论币原创,以上分析仅为个人观点,仅供大家参考,投资有风险,入市需谨慎,转载请注明出处!更多分析建议关注公众号:小冯论币
免责声明:本文章仅代表作者个人观点,不代表本平台的立场和观点。本文章仅供信息分享,不构成对任何人的任何投资建议。用户与作者之间的任何争议,与本平台无关。如网页中刊载的文章或图片涉及侵权,请提供相关的权利证明和身份证明发送邮件到support@aicoin.com,本平台相关工作人员将会进行核查。


