On the previous trading day, Ethereum showed a trend of oscillation and upward movement during the day session. It was suppressed and pulled back near the 3680 level of the daily midline, and rebounded near the 3545 level several times in the evening session, now oscillating around 3615.
Changlu also mentioned in the article yesterday that the market will rebound again to test the pressure of the daily midline. If it fails to break through, short positions can be entered near 3660, while attention should be paid to the support near 3565 below. If it does not fall below, long positions can be entered. Combined with the points provided in real-time strategies, friends who follow the operations can have good gains in both long and short positions.
Ethereum Market Analysis: In terms of the weekly chart, the market rebounded after pulling back to the support near the 5-day moving average, and the technical indicators showed a turning upward trend. On the daily chart, the market rebounded again yesterday but was pressured by the midline and fell back, showing a double-pin top trend. If it fails to smoothly break through the high level during the rebound, it will continue to pull back to the support near 3540, the vicinity of the 5-day moving average. If it breaks through, it is likely to continue to pull back. However, attention should still be paid to the time of the halving of the "big cake" (Bitcoin), which may lead to a tempting downward trend before rebounding, similar to the continuous rebound trend of the "big cake" after the halving in 2020, which lasted until 2021. We can refer to the previous trend to plan the entry timing. However, if the pullback to 3050 is the first wave of the correction, then this rebound may be the second wave of the rebound. If the rebound wave fails to reach a new high and falls below 3050 again, it may form a five-wave pullback model, which also needs to be paid attention to on the daily chart level.
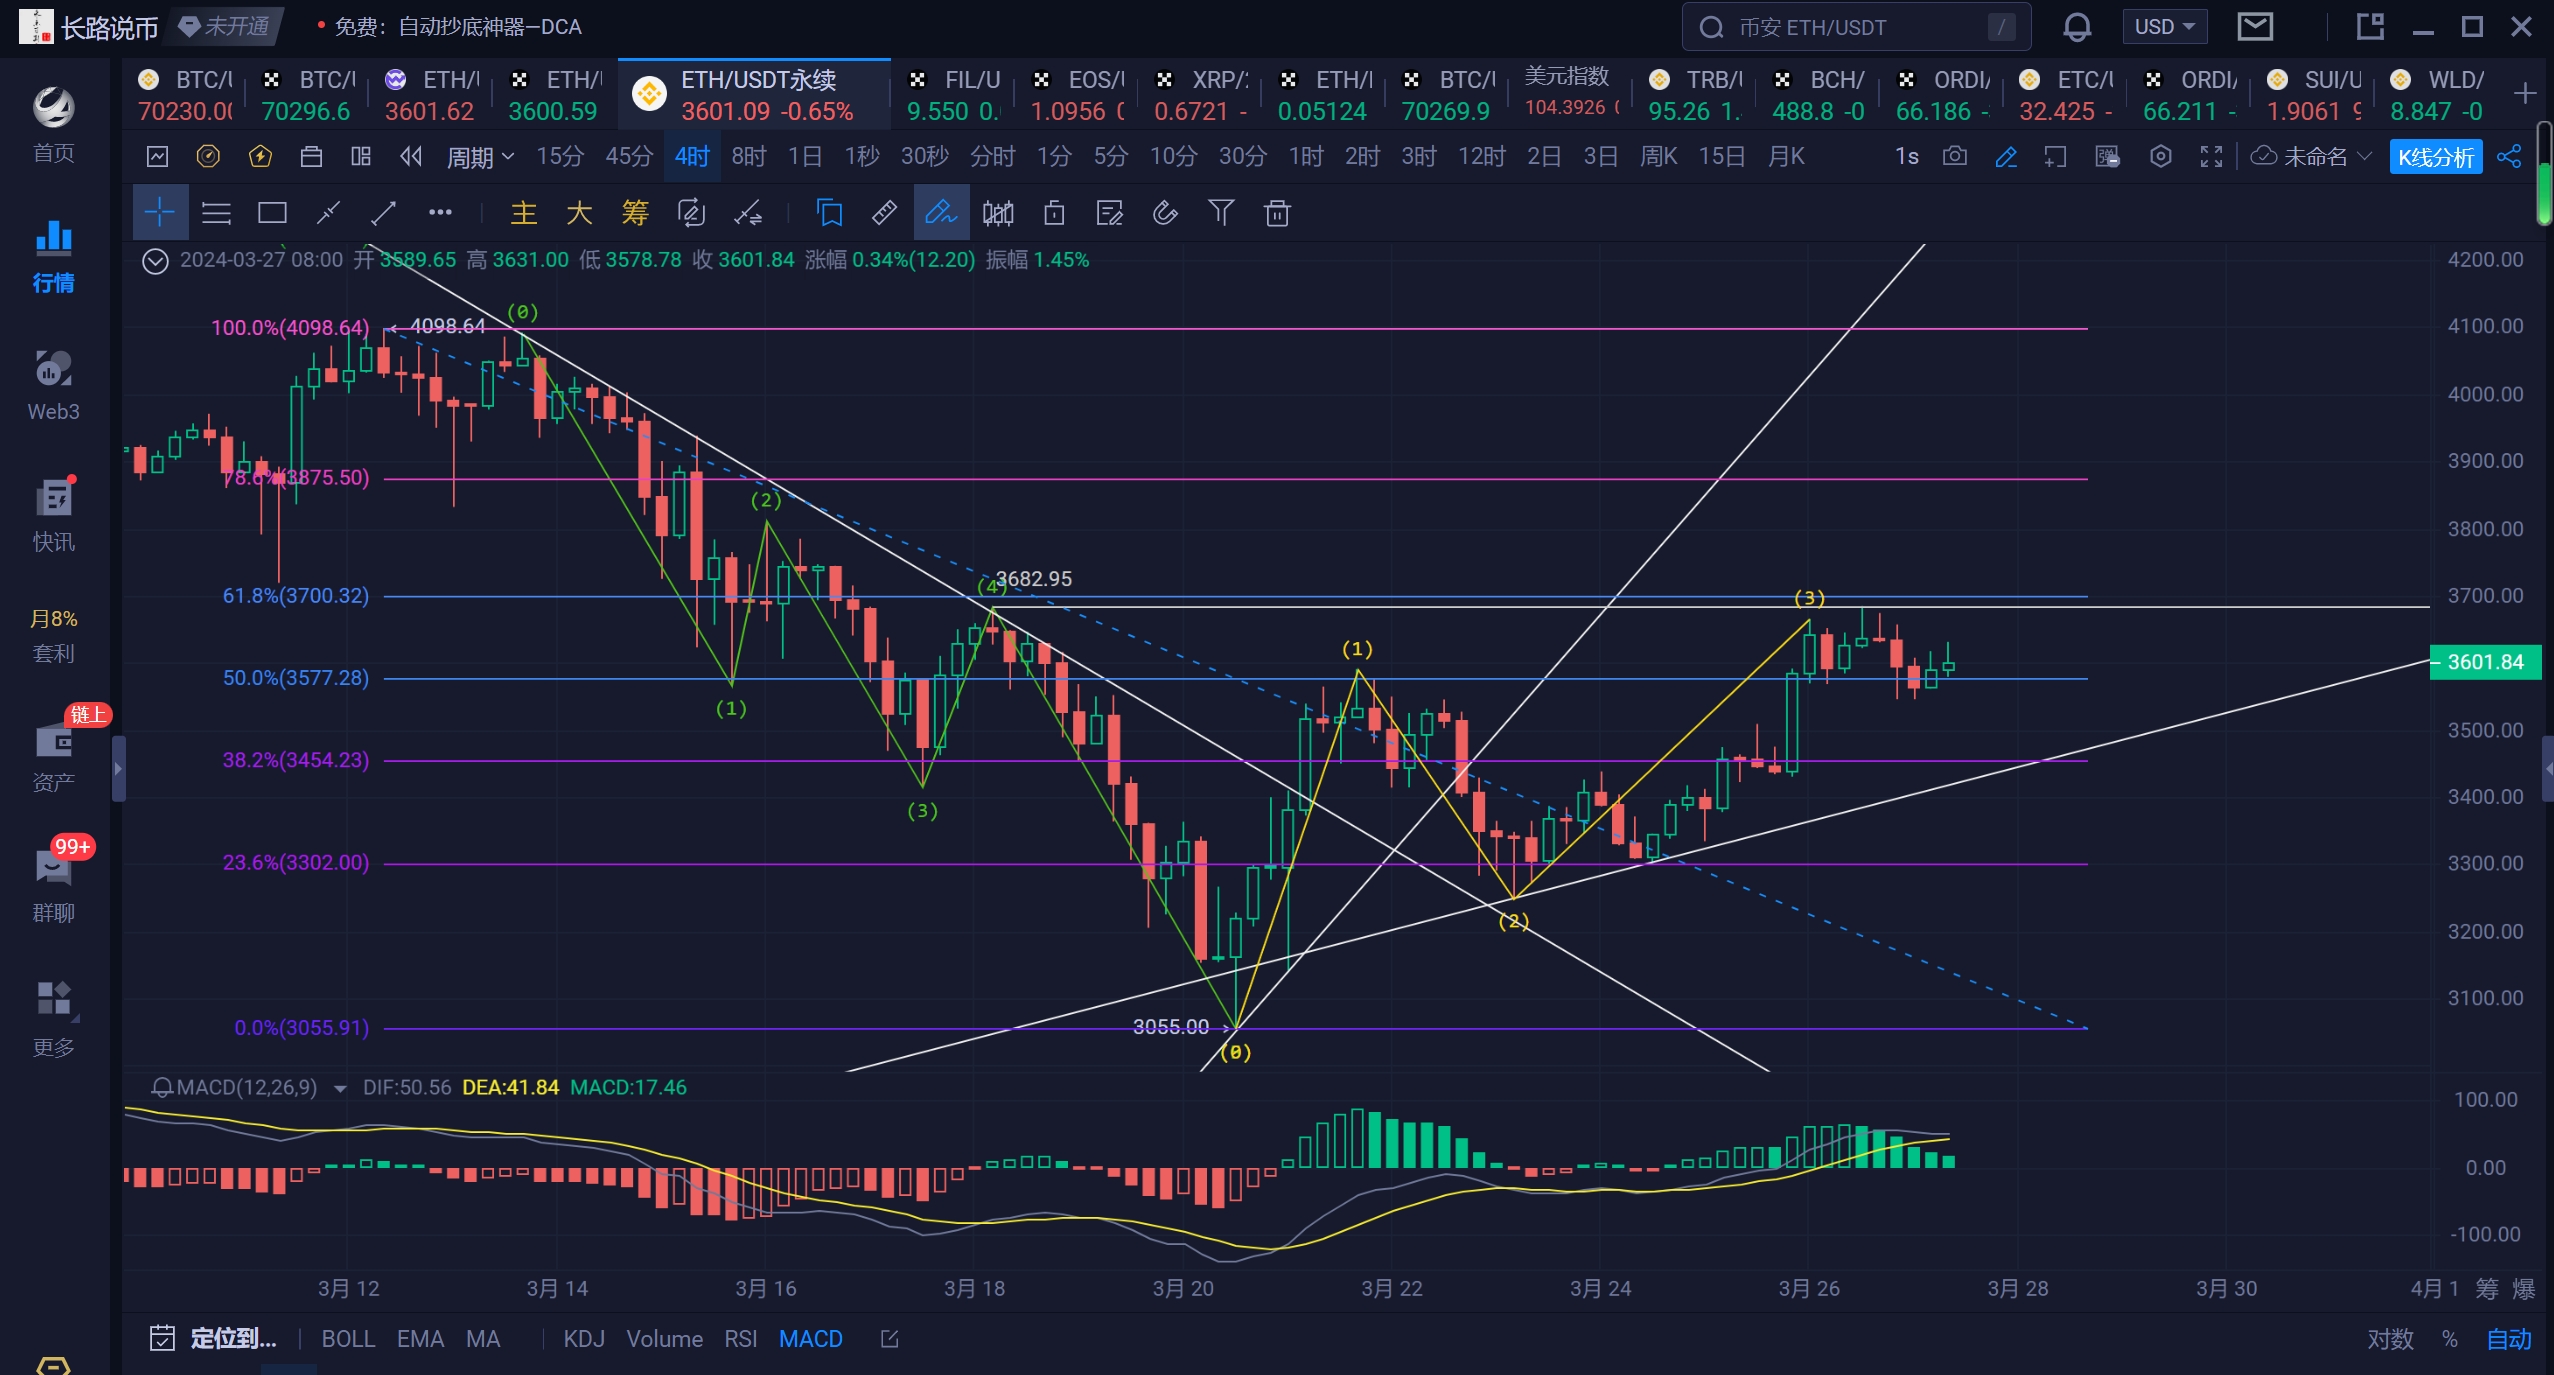
On the 4-hour chart, the rebound of the market just touched the resistance near 3880, which is the upper neckline position of the three-wave rebound. From the technical indicators on the 4-hour chart, the MACD still shows a trend of decreasing volume, and other technical indicators also show a downward trend. If this rebound fails to break through the high point above 3680, there may be a four-wave pullback trend. Attention should be paid to the support near the Fibonacci retracement line 0.5 at 3575 below. If it breaks through, there is a chance to test the support near 3520. After forming the bottom, a five-wave rebound will be observed, and the strength of the five-wave rebound needs to be paid attention to. Today, Changlu suggests that if the rebound does not break the high point above, short positions can be entered, and attention should be paid to the support near the lower rail at 3550 below.
Operational suggestions: Refer to real-time strategies.
Reminder: The strategy is for reference only. Operate with good stop-loss and take-profit measures. Set profit-taking targets and implement trailing stop-loss to protect profits and avoid excessive profit loss.
The cryptocurrency market is always in full swing. It is everyone's common wish to seize the opportunity and get a share of the pie. Please believe that "the only thing missing between you and financial freedom is a long road." With the guidance of Changlu, you will definitely achieve the dream of wealth in the cryptocurrency market faster and more steadily.
免责声明:本文章仅代表作者个人观点,不代表本平台的立场和观点。本文章仅供信息分享,不构成对任何人的任何投资建议。用户与作者之间的任何争议,与本平台无关。如网页中刊载的文章或图片涉及侵权,请提供相关的权利证明和身份证明发送邮件到support@aicoin.com,本平台相关工作人员将会进行核查。


